Function Plotter is a graph plotter app for Windows 8; to plot graphs. Use Function Plotter app to plot graphs and study their properties, by feeding in functions of your choice.
Function Plotter can plot almost any of the scientific or engineering functions. You just have to input the function and choose the required variables; the app will plot the function for you. You can also study various properties of the graph plotted. You can view graphs of any complicated function, but you can’t download them on your Windows 8 or share them.
How To Use Function Plotter App:
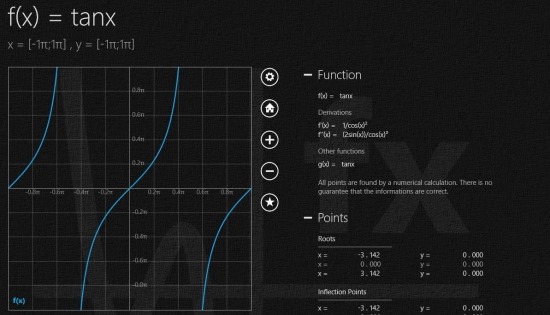
Function Plotter app is used to plot functions, by inputting the equations and their variables. As you can see in the above screenshot, I have input tan(x) function and the X and Y coordinates, the app plotted the graph on it’s own. It’s even showing: derivatives of tanx, points, integral limits, intersection points, etc.
As soon as you launch the app, you will see a sample Sine function plotted for you and it’s properties defined on it’s right side. You can plot two functions simultaneously on this app; the two functions are assumed as: f (x) and g (x). As you can see in the above screenshot, there are a few buttons in middle of the graph and properties of the function. The buttons are: options, home, zoom in, zoom out, and limits of the graph; from top to bottom.
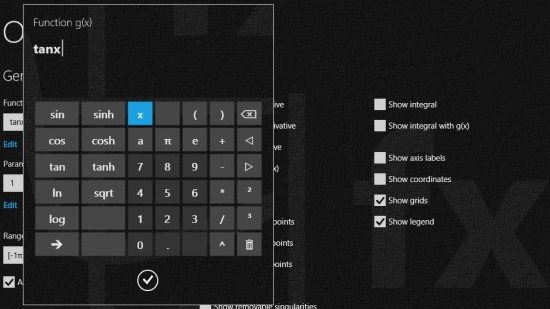
- Options: Using options, you can plot an other function (g(x)) in the already existing graph. You can use the edit option and you can input any function (as shown in below screenshot). You can set other properties also like: draw first derivative, plot poles, show maximum, show minimum, etc. There are lot of property options that you can make use of from this app.

- Home: Home option is just for returning back or refreshing the app.
- Zoom In: Zoom In option just zooms in the graph and the graph co-ordinates will change accordingly.
- Zoom Out: This option let’s you see more coordinates on the graph. It just zooms out the graph that has been plotted.
- Limits: You can select from a predefined list of limits and the graph will automatically change, according to the option you have chosen.
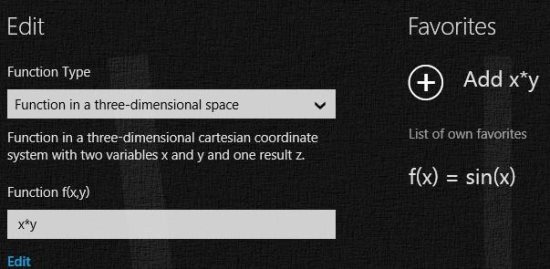
To change the main function, just click on the function that is being displayed on top of the graph (or just right click and choose edit option). Then you will see a screen as shown below. Click on the function type and you will see options like: normal functions, functions in complex numbers, functions in three dimensional space, functions in parametric equation, and function in polar coordinate system. Below that you can use the function category to edit the function of your choice. Then you can just navigate back using the backward button and the graph will be plotted for you.
Features of Graph Plotter App For Windows 8:
Below are the features of Graph Plotter app for Windows 8:
- This app is available for free.
- You can plot graphs and study it’s properties.
- Plot functions in: cartesian coordinates, complex numbers, 3D space, parametric equation, and polar coordinate system.
- Plot two graphs at a time and compare them.
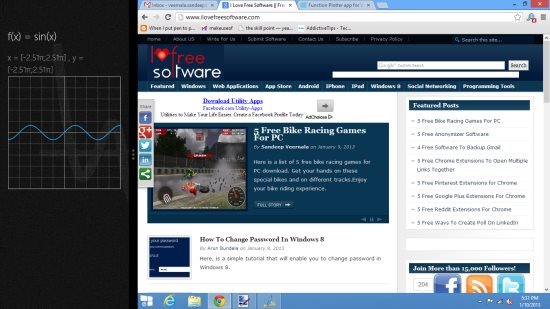
- This app can be used in Snap mode also.
Installing Function Plotter on Windows 8:
You can find Function Plotter in tools section of Windows 8 or else open this link in Internet Explorer, of Windows 8 and view the app in Windows Store. Install it from there.
Plot graphs of your choice and this app can also be used to complete your home work or office work. You can also try: Periodic table app or Learn Spanish App.


