Champion Stock Chart Viewer is, as the name of this application suggests, a free stock price checker, which you can use to view stock price updates and history on either Google or Yahoo stock market report sites. If you are an investor, then keeping track of the stock market prices is very important, because it allows you to make informed decisions on weather you should sell a stock, or keep it, and it can even be very useful when it comes to stock price history research.
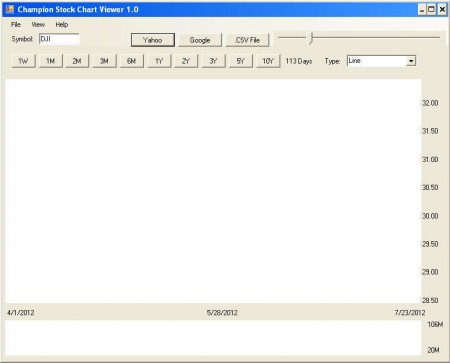
Default interface of this free stock chart viewer application is very simple, all the key components are clearly laid out, the only thing that might be a little bit confusing to some is how exactly to track stock market prices. It’s actually very simple, you need to find out what the three letter symbol of the stock that you’re interested in monitoring is, and simply enter it in the Symbol box in the top left corner. List of features that Champion Stock Chart Viewer has to offer is rather impressive:
- Yahoo and Google Finance stock price reports
- Different types of price charts – Line, Bar, Candlestick
- Pre-made time periods where stock prices can be viewed – weeks, months
- Time slider, where you can select a specific number of days for price tracking
- Data export to CSV files or images
First step in using this free stock market price checker would be to open up either Googe or Yahoo Finance and see what the previously mentioned symbols of stocks that you’re interested in tracking are. After that, you need to open up Champion Stock Chart Viewer and start viewing the price history.
Similar software: 5 Free Stock Tickers, Scrolling Stock Prices, StockViz.
Free stock market chart viewer – Champion Stock Chart Viewer
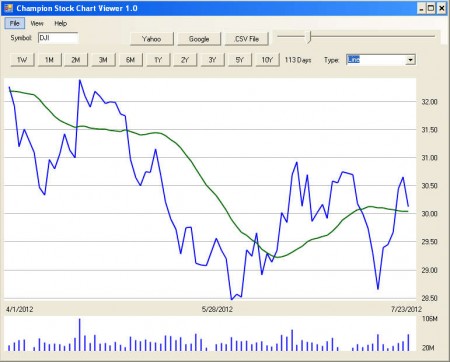
As you can see on the image above we have a stock opened, it’s the DJI stock. To open up the stock chart you need to write this three letter stock symbol inside the Symbol field after which you need to click on either Yahoo or Google button, depending on which service you’ve used to get the stock symbol.
After clicking on the service name button, the stock price chart will open up in the center of the program. Default time span for the stock price will be set to high, making the chart difficult to read. You can use the time slider in the top right corner to change the number of days, or you can simply click on one of the pre-made time periods, week, month, year, to see the chart more clearly.
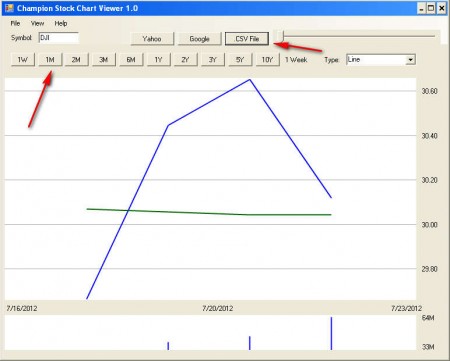
Here we see a chart set to a one week period, which is significantly simple. Charts and data about a certain stock can be exported via CSV files, notice the button at the top, next to the slider. There are two lines present, the blue one is the stock price, while the green one is the stock moving average.
Conclusion
If you’re looking for a free stock chart application to help you monitor stocks, then Champion Stock Chart Viewer is just the thing you need. Application is free, download it and see how it can help you in your stock market trading adventures.