PAST, acronym for “PAleontological STatistics” is a free scientific, paleontological, and statistical analysis software for Windows. The software comes with lots of powerful features for data manipulation, plotting, dealing with the univariate, multivariate statistics, ecological analysis, time series analysis, spatial analysis, and many others. PAST comes with a spreadsheet like interface in which you enter your data. And you can also export the spreadsheet as an Excel file.
The software is best suited for the people who often deal with the scientific data. Using this software, they can easily analyze the data which they have gathered after a research. The software includes almost all the required features. For example, if you are working on an ecological project, then you will get Google Maps, surface graph, and diversity test like functions for handling your data.

So, let’s see what are the different features that you will find in this software.
Use this Scientific, Paleontological, and Statistical Analysis software to Plot graphs
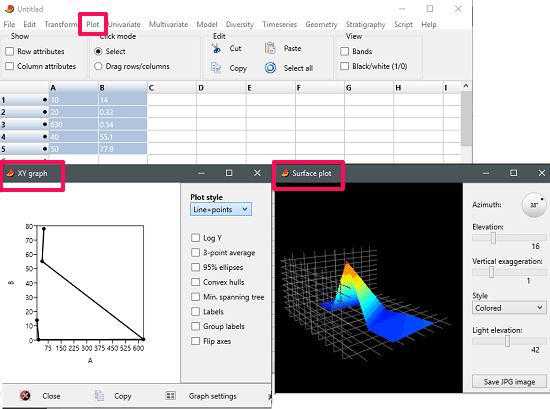
PAST comes with various types of graphs in it that you can use to visualize your data statistically. It has a separate menu for choosing the graph from the list. Currently there are 16 types of graphs available in the software such as a simple XY graph, Histogram, Pie chart, Stacked chart, bubble plot, 3D plot, Surface plot, and many others. You can choose any of the graph from the list and after plotting the graph, you can copy it to the clipboard or directly print it.
In the spreadsheet, you can add the data and then choose any graph from the “Plot” menu. After that a window will pop up with your graph in it. In the graph window, you can customize the XY labels, units of the graph, font, font size, etc. You can see the below screenshot, showing the surface and an XY graph for a random data.
Deal With the Univariate Data With PAST
In PAST, you can analyze univariate data (data that require only one variable) using the various built in functions. You can calculate basic statistical attributes such as Mean, Median, Mode, and some higher level calculations such as Bootstrapping, correlation, and Survival analysis. Not only, this, you can also use another univariate based functions such as running one-sample-test (t, Wilcoxon, single case) and two sample test (f, t, Kolm-sm, etc.).
To start with the any Univariate function, simply enter one variable data in a column. After that, select the column and then choose any of the univariate function from the “Univariate” menu. A windows will pop up with the calculated result. You can then analyze the result and copy or print it from the windows itself.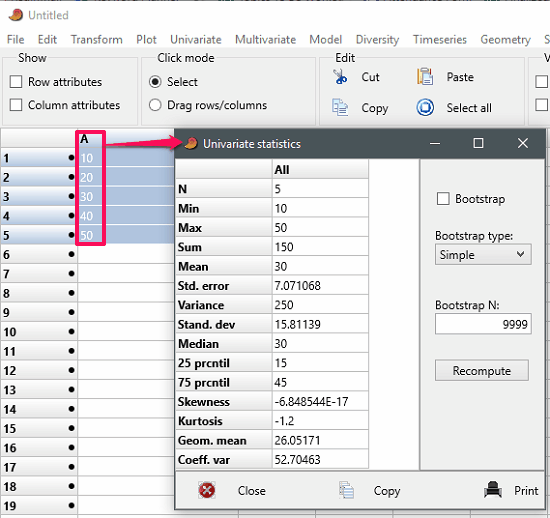
Deal With the Multivariate Data With PAST
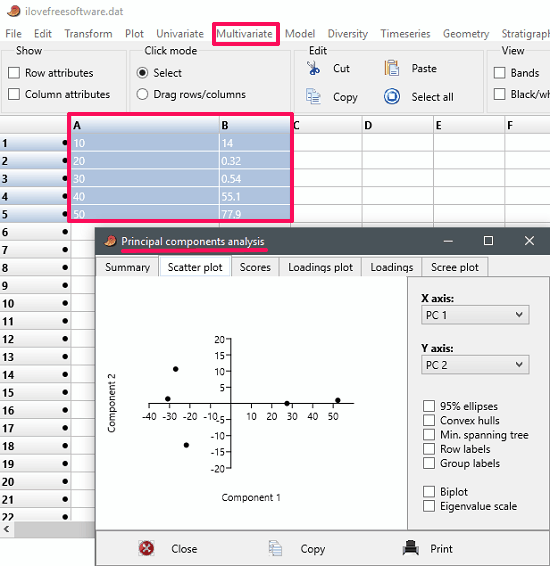
Calculating and analyzing the multivariate data can also be done in PAST. It has included many multivariate analysis functions in it. And you can use them to process data that requires more than one variable simultaneously to analyze the multiple variable dependent outcome. The main functions that it has included in the multivariate section are Genetic sequence stats, Ordination, Clustering, tests including One-way ANOSIM, Two-way ANOSIM, SIMPER, MANOVA, etc.
The process of using the multivariate functions is very easy and similar to what I have used above. Just enter your data in the two columns of the spreadsheet and choose any function from the “Mutivariate” menu. After that, it loads the result for you in new pop up window. You can copy the data to the clipboard or print it.
Use Curve Fitting Models to represent your Data
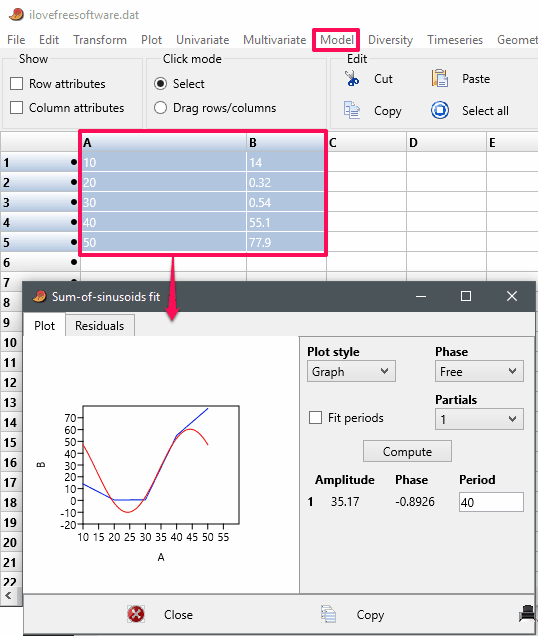
PAST has various common and complicated curve fitting models to construct curves or mathematical function. You can type data points in the columns corresponding to the X, Y or any other variable. There is a “Model” menu in the software where you can find the various modelling methods. You can construct linear, polynomial, Non linear fit, Sum of sinusoids, Logarithmic spiral like curves using PAST and then print them directly.
Enter your data points in the spreadsheet and then select the points that you want to fit in a curve. After that, select any modeling methods from the “Model” menu and then it will plot the corresponding curve for you. See the following screenshot in which I have fitted a linear and Sum of sinusoid curve using some random data.
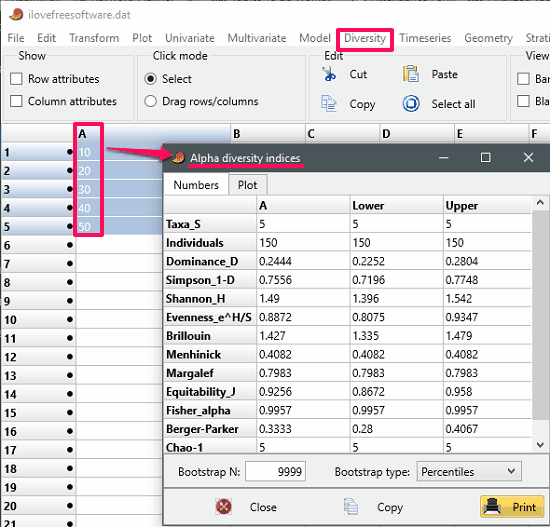
Analyze Ecological Statistics With PAST
Ecological statistics help to determine the variation in various parameters of the terrestrial and aquatic ecosystems. You can calculate the ecological statistics such as Diversity indices, Diversity t test, SHE analysis, Beta diversity, and many others using PAST.
If you are familiar with the biodiversity and ecology concepts, then you will be easily able to analyze the above ecological statistics of your choice. All you have to do is specify the data regarding to the particular ecological constraints. After that it will calculate the corresponding result for you. After getting the result of your analysis, you can do whatever you want. See the following screenshot showing diversity indices for a random data.
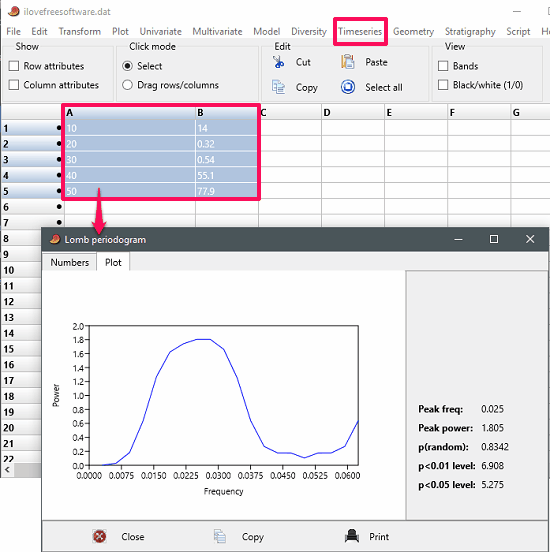
Do Time series Analysis With PAST
Time series is the collection of discrete-time data points which are taken by observing a certain phenomenon by keeping the timing constraints in mind. The heights of the ocean tides can be thought as a perfect example of time series data. And PAST comes with various Time series analysis methods to extract out the valuable statistical information from the Time series data that you have observed. You will find various methods for Time series analysis, such as spectral analysis, ARMA, Correlation, Runs test, Markov chain, and many others.
Use the columns of the software to enter Time Series data. After that, choose any analysis method from the “Timeseries” menu. PAST will then give you the corresponding result in a pop up window. You can either print the result or copy it to the clipboard.
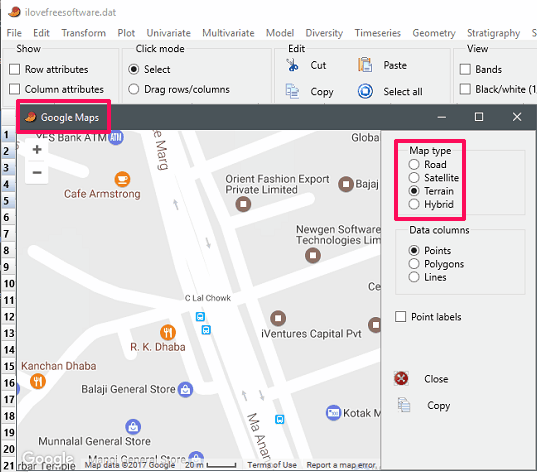
So, these were the main features and functions of the PAST software. Apart from the above features, PAST comes with some other features also, such as built in Google Maps which you can switch into terrain, satellite, hybrid, and road view. Also, you can use the map in the same way as you use it on Google Maps website. And you can also copy the current viewing map to the clipboard and then use any image editor to export it as an image.
All, in all I find PAST is the best free scientific, paleontological, and statistical analysis software for Windows. If you are more into the scientific field, then I am sure you will like this software for its simplicity. And powerful features and functions are what makes this software a unique one of its kind.
My Final Verdict
In the article above, I have explained about PAST, a free scientific, paleontological, and statistical analysis software for Windows. Using this free software, you can easily calculate and analyze various types of statistical, scientific data. The software is very smart to handle the intermediary calculations and it will not disappoint you in any way. You can download it from the link given below.