CodeAnalyzer is a pretty useful free software to analyze code metrics. Simple and easy to use, yet powerful, CodeAnalyzer is a java based application that lets you analyze single or multiple source code files to view their overall metrics. It can be used to view a variety of code metrics such as total lines, code lines, comment and whitespace lines, code to comment, and code to whitespace ratio. CodeAnalyzer features built in comment and file extension definitions for a number of programming languages, such as C, C++, Java, Assembly, and HTML. It can even generate full reports of the code analysis in different formats (CSV, TXT and full HTML). While there are other similar software applications like SourceMonitor, what sets CodeAnalyzer apart is the fact that it can generate analysis reports in multiple formats, including nested folders. And to top it all off, CodeAnalyzer runs as a portable standalone application (provided you have Java installed) and measures under 500 KB in size. Sounds like something that could make analyzing your project files a little easier? Let’s find out more.
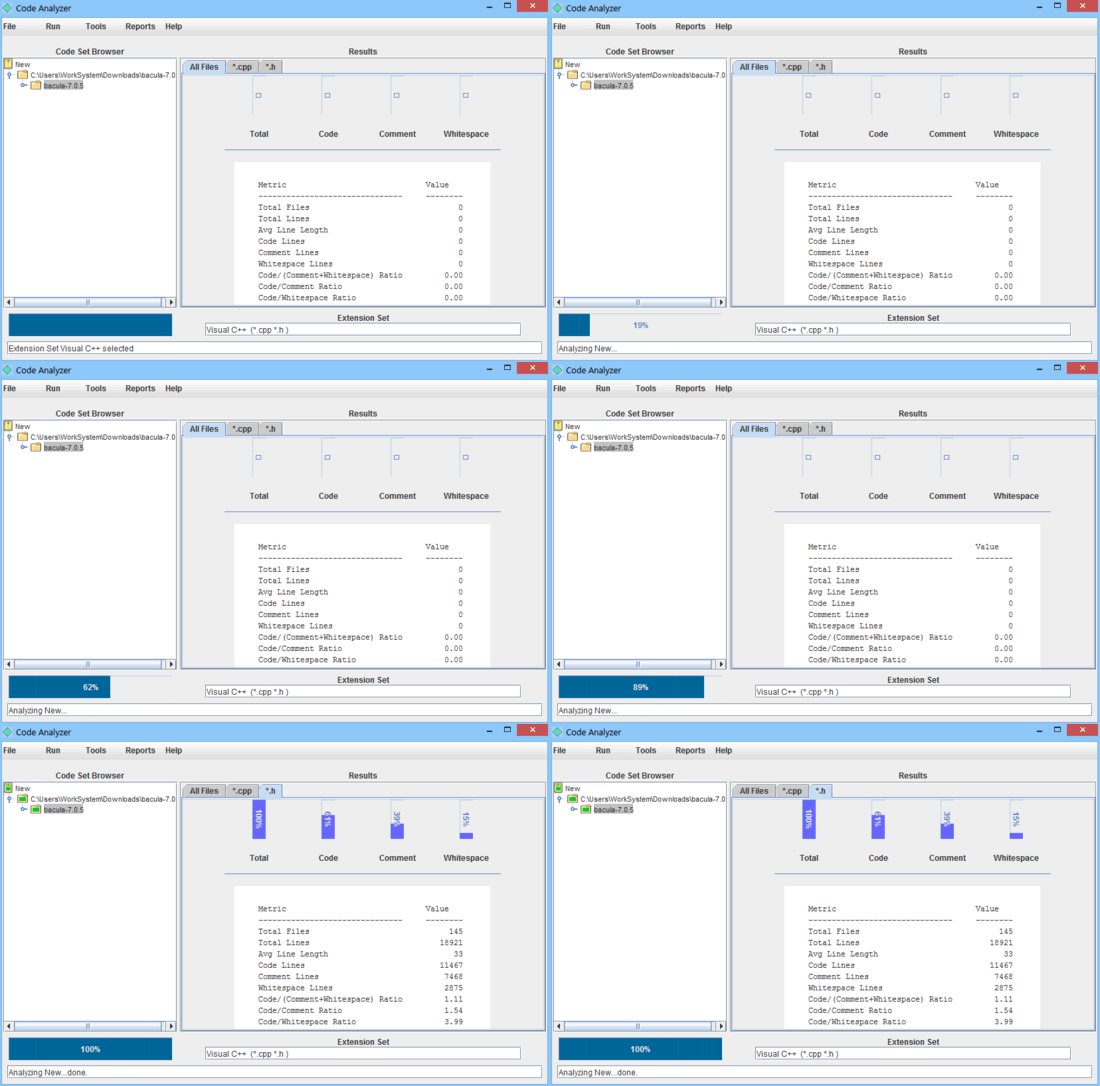
CodeAnalyzer: User Interface
As mentioned before in the article, CodeAnalyzer is an ultra-lightweight standalone portable Java based application. This means that there are no setups, downloads, installations or anything of that sort. All you have to do is download the application and run it. Here’s how the user interface of CodeAnalyzer looks like:
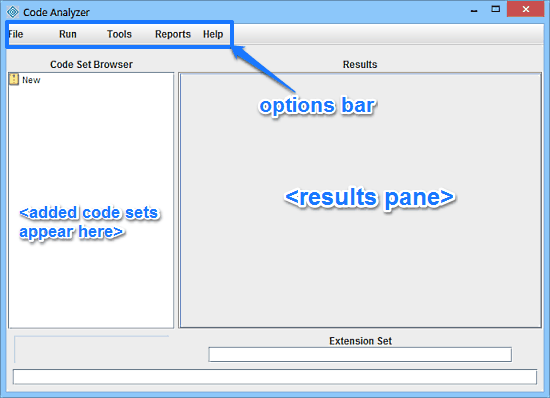
As illustrated by the above screenshot, Code Analyzer features an utterly simple and easy to navigate user interface. It’s primarily divided into two panes. The left pane is called the Code Set Browser and as the name suggests, this is where all of your added source code files (and the folders containing source code files), also known as Code Sets, appear in a tree like structure. The wider right pane is for the Results. The detailed outcome of the analysis of your source code files is shown here. Apart from that, there’s just a basic menu bar with a couple of options, as mentioned below:
- File: Contains options for creating as well as saving new code sets, and opening existing code sets.
- Run: Consists of options to run/stop the code analysis process.
- Tools: Under this, you can select the language sets whose code comments and extensions are included in the code sets. You can choose from the available options: C, C++, Java, HTML and Assembly.
- Reports: As the name suggests, you can generate reports of your analysis in different formats via options included in here.
- Help: Consists of help documentation and other general information about the application.
How To Use This Free Software To Analyze Code Metrics?
Using CodeAnalyzer to analyze your source code’s metrics and generate their reports is really easy. Essentially, all you have to do is add the files/folders to the code sets, and let CodeAnalyzer handle the rest. Here’s a little step by step process, illustrating how to get started:
Step 1: Right click on New in the code set browser and click Add Branch. From the browser window that pops up, select the location where your source code files/folders are located, to add them to your Code Set.
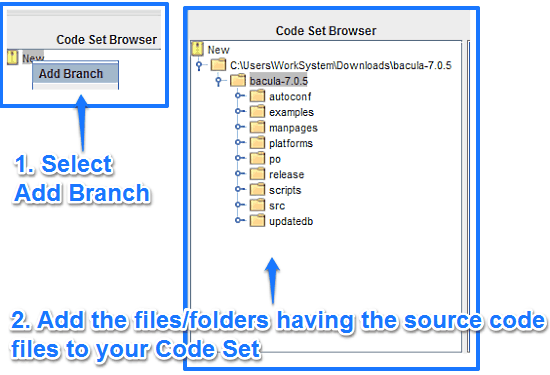
As illustrated by the above screenshot, once you do that, all of the source code files (and associated folders) are added to your Code Set. These are easily viewable through the code set browser via a tree like structure.
Step 2: Next up, select the extension set from the Tools menu option. At this step, you are required to choose the language whose source code files you have included in your code set. The extension you select is the one whose source code files you need to include in the analysis and reports (e.g. If you have added C and C++ language source files, select the C,C++ extension set having .c and .cpp extensions).
Step 3: Once everything is done, simply start the analysis by clicking Run from the Run menu item. Code Analyzer will now work its magic on your source code files and folders for a few moments, and fire up the results once done. Check out the screenshot below:
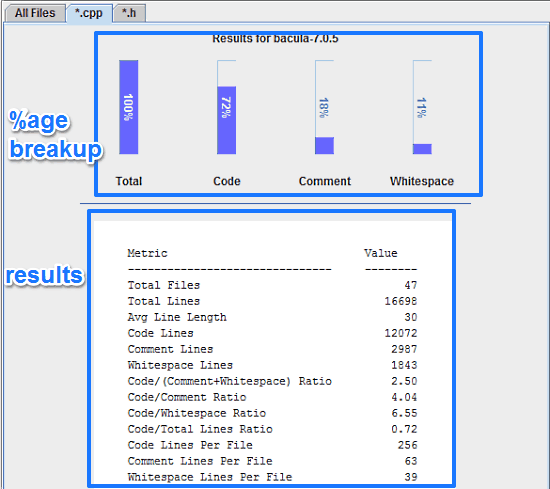
As illustrated by the above screenshot, the results window gives a detailed break up of all the metrics in your code. The top section gives the %age breakup of primary code elements such as code lines, comments and whitespaces. The bottom section provides much more granular results, with the exact number of all the metrics such as total lines (in all the source code files), whitespace lines, code/comment ratio, code lines per file, and even average line length. How cool is that?
Also see: 3 Free Software To Count Lines Of Code
How To Generate Reports Of Code Analysis?
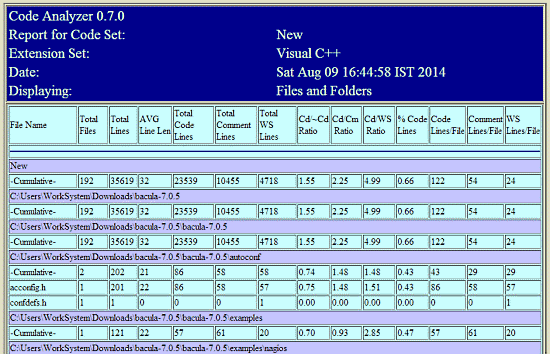
Once you’re all done with the analysis of your code’s metrics, you can also have CodeAnalyzer turn the results into some great looking reports. It can generate reports in CSV, TXT or Full HTML formats. Generating reports is really simple. Simply go to Reports, select the format for the report, specify the save location, and you’re good to go. It’s really that simple!
Here’s how a sample full HTML code analysis report looks like:
Conclusion
CodeAnalyzer is an amazing software to analyze code metrics. It’s simple, easy to use, and works exactly the way it’s supposed to. Features like support for multiple languages, extension sets, super fast analysis make it a must have a tool for anyone who has to work with multiple source code files on a daily basis. Add to it those nice looking analysis reports, and CodeAnalyzer becomes even more awesome, all the while remaining super lightweight and portable. I suggest you give it a try, you’ll love it.