WTFUtil is free open source dashboard terminal with todo, weather, IP details, clocks, and some other configurable modules. There are some other dashboard creators you can use but if you prefer a terminal based one then WTFUtil is for you. It comes with a long list of widgets which you can configure and use it to display some meaningful data. Along with this, you can use the keyboard controls to edit some values and the dashboard will update itself after the specified interval of time.
A dashboard is used to keep an eye on some stats which are helpful in your day to day work. You can use dashboard to monitor your social media stats, system resource usage, and some others. The dashboard terminal which I have added here can show much more than that. All you have to do is configure it accordingly using a simple configuration file. Also, since it is an open source tool, you can create some custom modules for it yourself if you know coding.
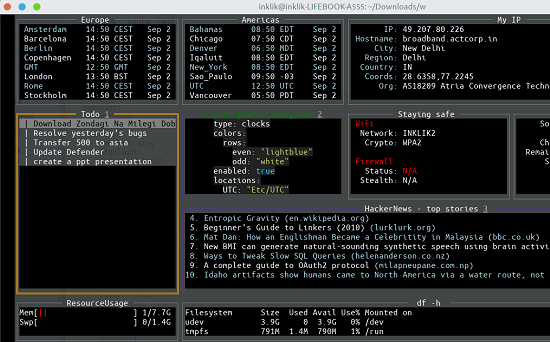
WTFUtil currently works on Linux and MAC. There are pre-compiled binaries for it and you just download them and start using it. All the modules that it supports are customizable. From a Todo list, you can use it to display top Hacker News stories, your IP location, weather details, and much more. You can tweak different modules of this dashboard with a simple configuration that I will mention later in this post.
Main Modules Included in this Dashboard Terminal:
- GitHub: You can use this module to show status of pull request on the terminal. For this, you will need to use your GitHub API key and then configure this module. Apart from PRs, custom queries are supported.
- Hacker News: You just have to enable this module. After that, it will show you top stories from Hacker News and then you can use keyboard to navigate between them and open them in the browser. You can even specify the time interval to refresh the list of HN stories.
- Google Apps: This dashboard supports Google Apps like Google Calendar, Google Sheets, and Google Analytics. You can fetch your calendar and add it to the dashboard. Similarly, you can connect to the Analytics API and then retrieve current user information for your websites.
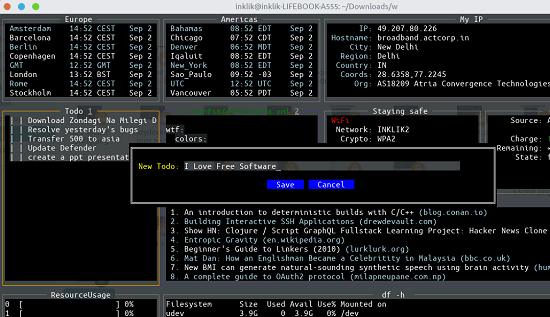
- IP Details: In the “My IP” section, you can see the current public IP address assigned to your PC. Along with this, you can see the geo-coordinates (resolved from IP), organization name, region, country, etc. And it will automatically refresh that if the IP changes.
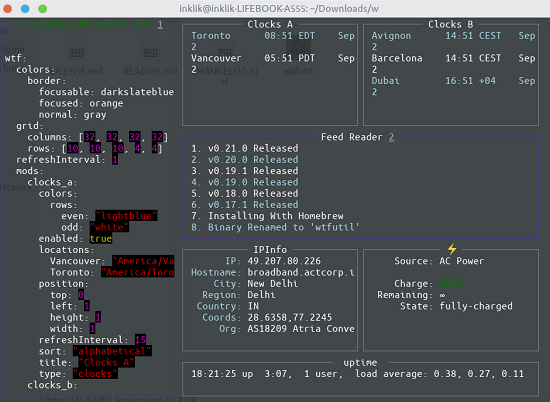
- Clocks: If you work with multiple time zones then you can simply add them here too. Here the “Clocks” module supports a list of world clocks, local time, and date. You just have to specify the time zones in list that want to display on your dashboard.
- Todo: You can create a Todo list on the dashboard very easily and then keep an eye on it. In the Todo list, you can add new tasks and mark the added tasks as completed.
- Jira: If you have a Jira account then you can opt to displays all issues assigned to you for a project. To do this, you will have to add your Jira API key and then create the configuration in the master config file.
- Twitter: With this module, you can connect to the Twitter API and displays single user’s tweets. For this, you will need a Twitter developer account to get the respective API keys. And in the configuration file, you will have to specify the screen names of the user whose tweets you want to monitor.
- Spotify: With the help of this module, you can control the Spotify client. Spotify’s play next song, play previous song, play/pause like commands can be controlled with this module. In order to activate this, you will need to generate a Spotify token.
- Feed Reader: This module is dedicated for showing the RSS and ATOM feeds from your favorite websites. For this module to work, you only need the feed URL of the websites or blog you want to add to your dashboard.
- Transmission: Transmission is a popular torrent client for almost all platforms. If you use Transmission for downloading torrents then you can monitor the download progress on the dashboard. Only host and password like details are required to configure this module.
- Trello: If you use Trello for task management then you can track your tasks here. Here you can connect to your Trello account and then simply view your cards. In order to connect to Trello, you only need to get the API key from your account.
Configuring and Using WTFUtil Dashboard Terminal to Shoe Different Stats:
It is very simple to use this dashboard terminal on a Linux or MAC machine. You can download the binaries of this dashboard tool from here. Next open the terminal in the same directory and then run the following command. A default terminal with the dashboard template will show up. Initially, it doesn’t have all the module. You have to enable them according to your needs. For complete list of configurations, you can see this page.
./wtfutil
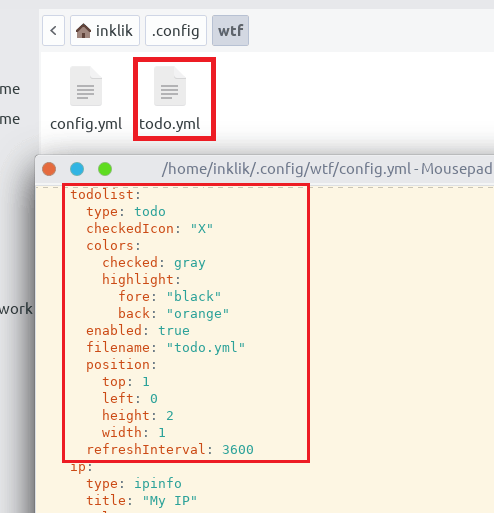
Now, it’s time to add different modules to the dashboard that you want to monitor. In the home directory, the default configuration can be found inside “.config/wtf/config.yml“. You can open it to enable a module that it supports, say the Todo list. You can use simply open the config file and then you can simply add the code for the Todo module as follows.
todo:

checkedIcon: "X"

colors:

checked: gray

highlight:

fore: "black"

back: "orange"

enabled: true

filename: "todo.yml"

position:

top: 2

left: 2

height: 2

width: 1

refreshInterval: 3600
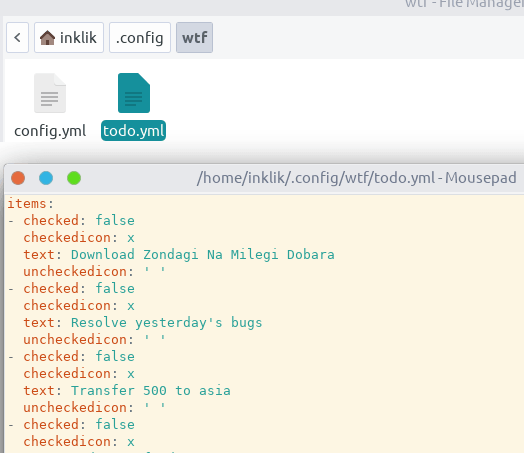
Corresponding to this, you will have to create a file in the same directory to save all the tasks. Give this new file a name “todo.yml”. You can see the syntax of the file to create todo tasks in the following screenshot. Or, you don’t have to do that manually as you can create Todo entry from the terminal itself. Just navigate to the Todo section and then simply press “n” key and create a new entry.
Now, after saving all the configuration, you can simply launch the dashboard once again. For the screenshot below, I am using a sample config file that is available in the GitHub repository of this tool. You can find it here and tweaking it a bit, the final dashboard will look like as shown below.
In this way, you can use this simple and powerful dashboard terminal to show some really useful stats. You just run the binary of the tool and then simply configure it according to your needs. The long list of modules that it supports is simply amazing, and I am sure it will fulfill all your needs.
Closing thoughts
Despite being a terminal based applications, this is one of the best dashboard creator I have ever used. The UI is really amazing and then most used widgets that you can configure is simply awesome. The best part is that the widgets that it supports are further customizable. You can change their color, position like parameters. This dashboard is most suited for techie people such as programmers and developers. So, if you are one of those then just give it a try and let us know that you think about it.