24HourCharts is a free API to generate charts in SVG and PNG format. Here you can use it to generate charts dynamically by making simple API requests. You just have to supply the chart data and then it will generate it for you in no time. It supports bar, horizontal bar, line, pie, stacked bar, stacked horizontal bar, and stacked line type of charts.
In the API response, you can get the generated chart as embeddable HTML, SVG, or PNG image. The API request syntax is a bit long, but once you understand it, it will be easier to build the call next time. You can make the API request through any programming language you know, as well as using the HTTP command line clients such as cURL and Httpie.
Generating charts dynamically can be tricky. If you’re building some app that requires chart generation, then hard-coding that stuff can be not efficient. And that’s where you can use 24HourCharts. Just get an API key and then start making the API calls. For free, you can make 100 requests per day.
Free API to Generate Charts in SVG and PNG Format
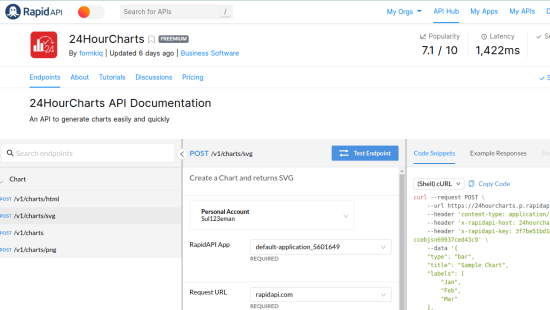
24HourCharts is hosted on RapidAPI. You just create a free account and then subscribe to this API here. Or, if you already have RapidAPI account, then you can just log in and then simply learn about the routes and docs that it has.
Next, you start making the API request. Just select any programming language from the list and it will show you the corresponding API syntax. You can see this screenshot below.
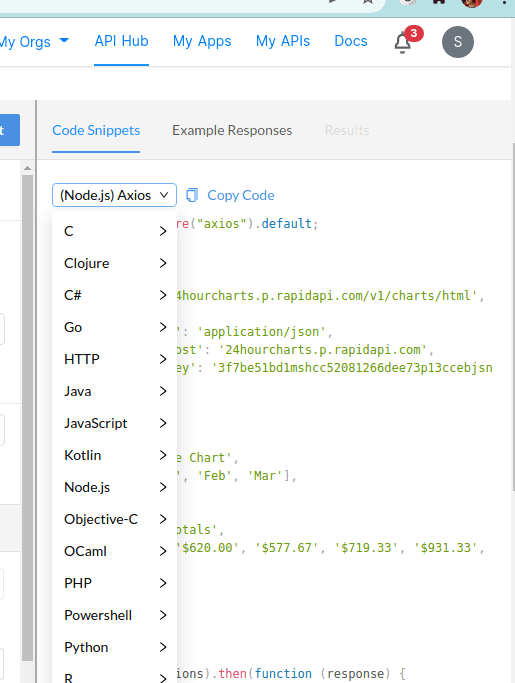
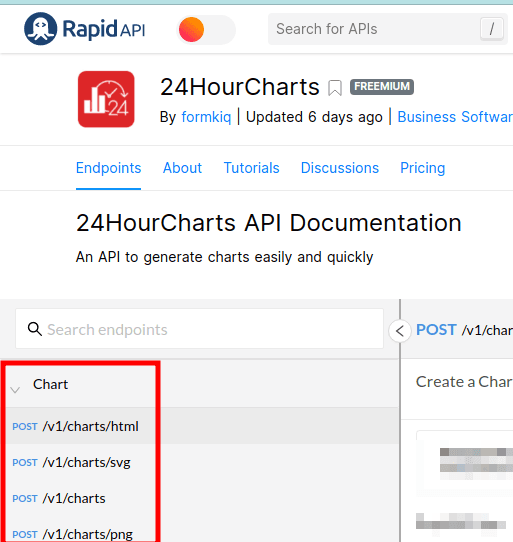
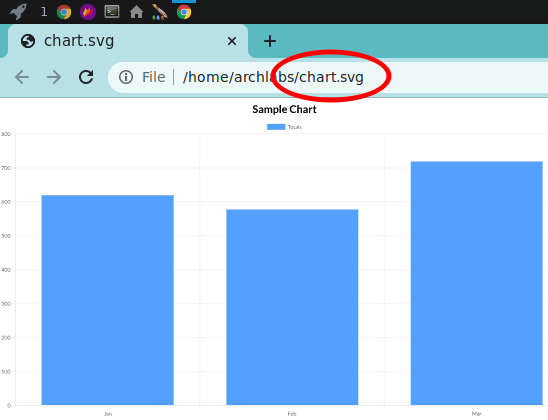
In my case, I will just make the API call from the Terminal using cURL. So, you just copy the cURL command then paste it in the terminal. For simple bar chart generation, you can use the following syntax. There are 3 routes for generation; for SVG, for PNG, and for HTML. Now, you get the response. I have saved the output generated by the above API call in an SVG file.
curl --request POST \
	--url https://24hourcharts.p.rapidapi.com/v1/charts/html \
	--header 'content-type: application/json' \
	--header 'x-rapidapi-host: 24hourcharts.p.rapidapi.com' \
	--header 'x-rapidapi-key: 3f7be51bd1mshcc52081266dee73p13ccebjsn69937ced43c9' \
	--data '{
    "type": "bar",
    "title": "Sample Chart",
    "labels": [
        "Jan",
        "Feb",
        "Mar"
    ],
    "datasets": [
        {
            "label": "Totals",
            "values": [
                "$620.00",
                "$577.67",
                "$719.33",
                "$931.33",
                "$712.08"
            ]
        }
    ]
}'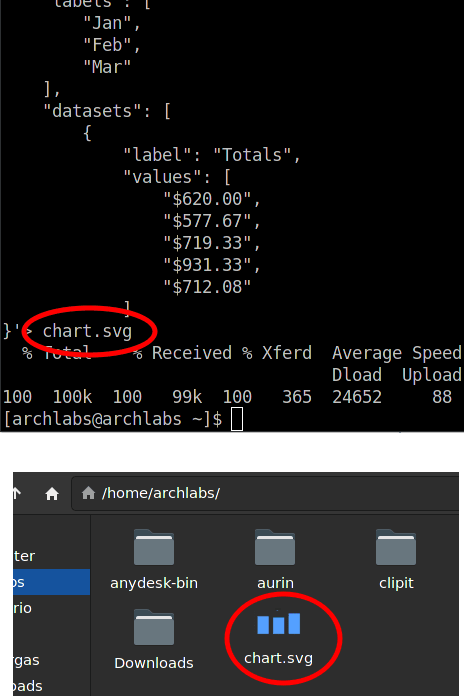
Open the SVG file in the browser to view the chart that the API generated. If the SVG file becomes too large, then you can simply compress using the SVG optimizer software out there. This is as simple as that.
In this way, you can use this simple chart generation API for free. Just modify the API call and then simply execute it to generate a chart. You can generate any chart dynamically, and then you are free to use that anywhere you want.
Final thoughts:
Generating custom charts can be tricky. But you can now do it using the 24HourCharts API. With this, you can also build charts after receiving the data as user input. For now, this is a very nice API and it does what it says. If you are a web developer, then you can give it a try right now and let me know what you think about it.