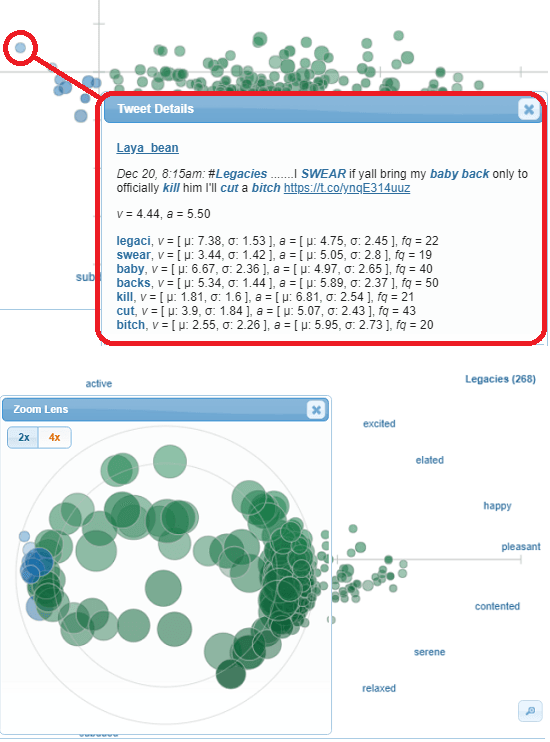
Sentiment Viz lets you see Twitter sentiment visualization of tweets on a topic. This is a simple website in looks but a very powerful one to analyze recent tweets containing a specific keyword. It grabs recent tweets as many as it can and then analyze them for detecting various sentiments in them like happiness, sadness, stress, nervousness, boredom, calm, and some others. It sketches the graph on its interface that you can visualize. It plots small circles on the graph, each corresponding to a tweet that it has fetched. If you want then you can see the actual tweet corresponding to a graph point by just hovering on it. It shows tweet’s text, corresponding user, and some other additional parameters.
If you want to analyze how people on Twitter reacting to certain topic then sentiment analysis is the answer. Recently I discussed about a WordPress plugin to do the same but in this post, I will be talking about doing sentiment analysis on Twitter. And this tool, Sentiment Viz does much more than just sentiment analysis. It uses some deep learning algorithms to analyze text of tweets and then generates a report. There are various sections on the website that you can use to visualize different aspects of the sentiments in an easy way. However, currently there is no option on the website to export the result of the analysis.
How to See Twitter Sentiment Visualization of Tweets on a Topic?
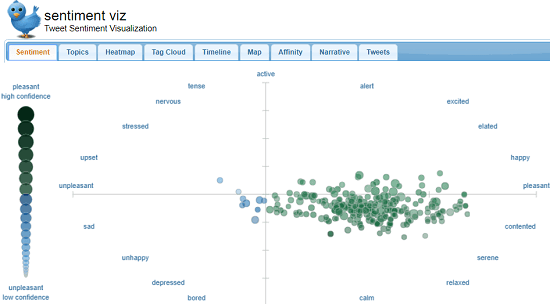
Using this intelligent website, Sentiment Viz is very simple. There is no need for sign up or registration. Just go to the homepage of this website and then enter the keywords for which you want to run the analysis. It will pull up some recent tweets and will plot them on the graph in a few seconds. The blue and green circles on the graph are actually the tweets that people have posted and it plots them according to the sentiments detected in them.
The sentiment results ranges from pleasant high confidence to unpleasant low confidence. Darker a circle on the graph indicates the positiveness. And the blue or light blue circles indicate negativeness and neutrality. You can hover over any circle to see the corresponding tweet as well. And you can use zoom on the graph to see them in more details.
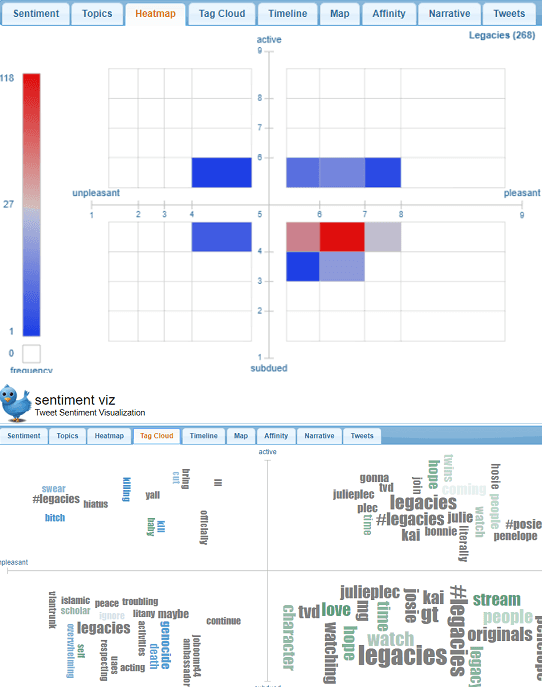
Next, you can move to the “Tag Cloud” and “Heatmap” section to see the more details about the analysis. In the Heatmaps section, it shows overall result of the analysis in terms of how much a topic is pleasant and non pleasant. And in the next section, Tag Cloud, you can see common words extracted from the emotional regions like happy, relaxed, Upset, etc.
In this way, you can analyze Twitter sentiments on a specify topic. You just have to enter a keyword based on current trend and see the results. The tool works as it should be and you can see the list of all tweets in the “Tweets” section with details like date, tweet text, and some other additional parameters. You cannot export tweets there but you can use a Firefox addon, Table Capture to do that.
Final thoughts
Sentiment Viz is a simple and a very nice online tool for twitter sentiment visualization. You can easily use this tool to analyze the sentiments of crowd on Twitter on a specific trend or topic. You just have to use some relevant keywords to see the sentiments analysis and analyze the result it produces. So, if you need a simple sentiment analysis tool for Twitter then use Sentiment Viz.