This post covers a free interactive map visualization of Quebec HMLs. An habitation à loyer modéré (HLM) is a form of low-income housing in France, Quebec, Senegal, and Algeria. The housing can be public or private with rent subsidies. In Quebec, HLM serves as a vital component of low-income housing initiatives, providing essential support for individuals and families facing economic challenges.
This map visualizes the low-income housing in the Quebec province of Canada. It is built with Mapbox using OpenStreetMap. It is available in French and English. The map layers HLMs by disrepair states with a rating from A to E. Users can select any particular area to get the HML by disrepair state and dwellings by disrepair state. The map features multiple clustering and filtering options that users can utilize to analyze specific areas in detail.
Check out Free Housing Affordability Calculator Websites for New Settlers and Get Property Valuation Prices via SMS for a Real Estate Address.
Interactive Map Visualization of Quebec HLMs
When you visit this map, it loads in French by default. From the top right section of the screen, you can switch it to French. The map shows all the HMLs around Quebec clustered together by area.
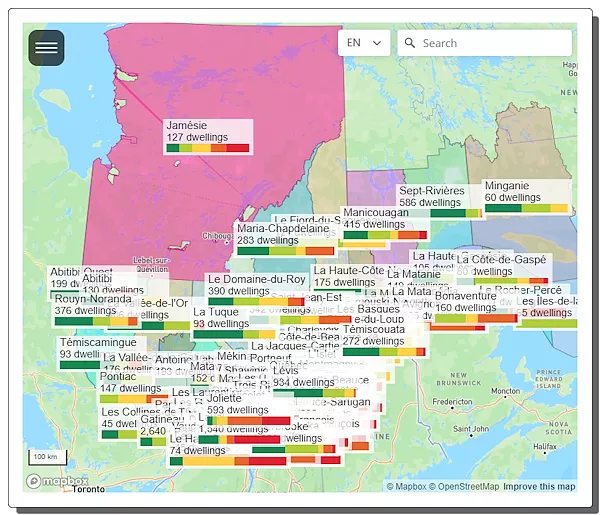
Each cluster has a label showing the area name on top along with the total number of dwellings. It also contains a color strip at the bottom that shows the disrepair rating from green to red. Green represents the lower IVP (Index of physical obsolescence of buildings) and red represents the higher IVP. The map has a panel on the left where you can access the HML clustering and filtering options.
HLMs Clustering
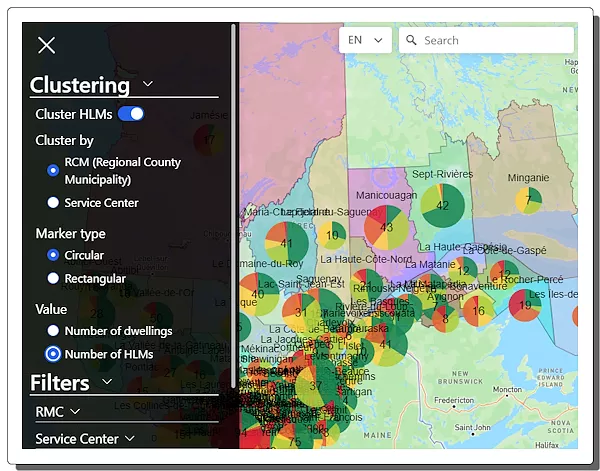
From the side panel, you can cluster the HMLs by RCM (Regional County Municipality) or Service Center. You can also change the marker from rectangular to circular. By default, the map shows the Number of HLMs but you can change it to the Number of dwellings if needed.
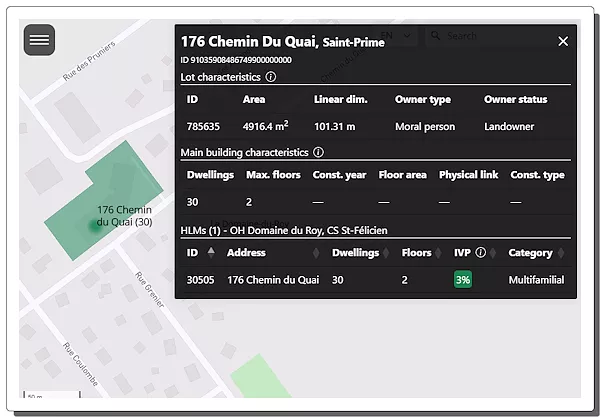
You can also disable the clustering that breaks down the HLM/dwelling listings from county to building. It marks the buildings on the map with their respective IVP values. You can select any building from the map to get Lot characteristics, Main building characteristics, and HLMs (1) ‐ Omh de Saguenay, CS Saguenay.
Filters
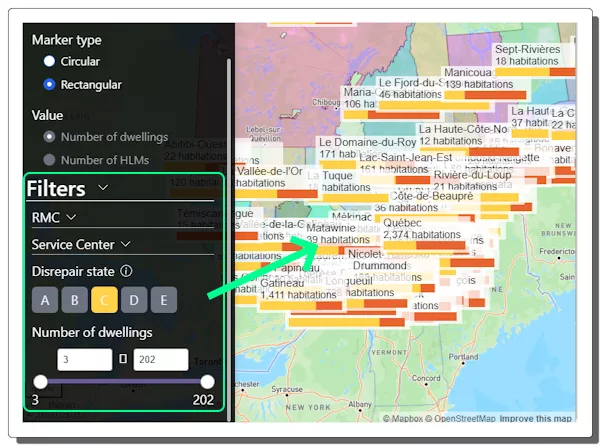
Coming to the Filters, the map lets you filter the HLMs/dwellings by RMC and Service Centers. It lists all the RMC and Service Centers in Quebec. You can expand the list or search the specific RMC and/or Service Centers to view on the map. Apart from that, you can also filter out Disrepair stage by rating and number of dwellings.
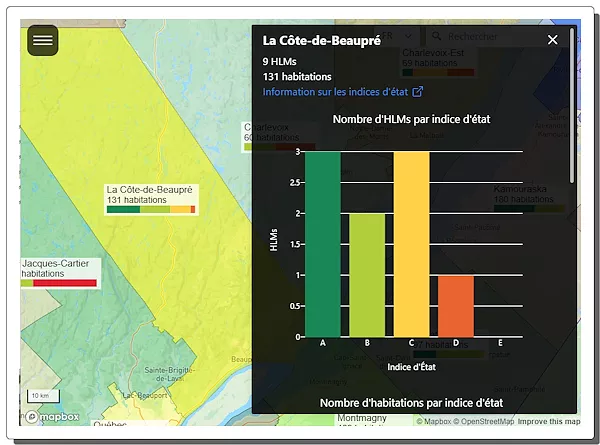
Selecting a county opens a bar graph over the map. This graph illustrates the HLMs in a disrepair state and dwellings in a disrepair state. Hovering the mouse cursor over this chart shows options to cut, crop, and download the chart as PNG. You can also jump to the official document and read about disrepair states.
You can explore these Quebec HMLs here.
Closing Words
This interactive map is a comprehensive tool for understanding the distribution and condition of low-income housing in the Quebec province. With features like clustering, filtering, and detailed information on disrepair states, users can delve into specific areas with ease. Whether you’re a researcher, policymaker, or concerned citizen, this resource provides valuable insights into housing accessibility and conditions in Quebec.