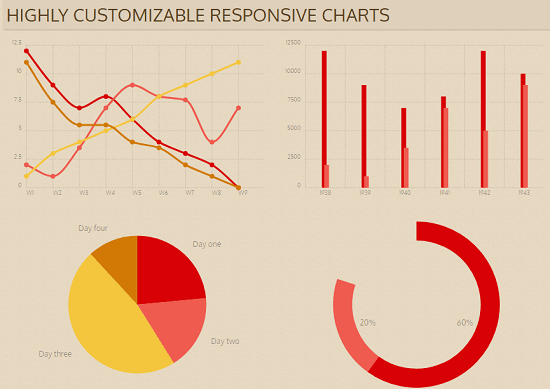
Chartist is a free open source SVG chart generation library that one can use. It is very advanced and supports generating a lot of charts with a lot of parameters. With this, you can generate colorful charts of any size and put them on your website. It even supports animation using CSS and thus with the help of this library, you will be able to generate animated charts and graphs.
In creating dashboards and webpages to show some kind of reports related data, you need charts. Many times, they needed to be dynamic or static. There are tools out there for that but not like Chartist. This is probably one of its kind. It comes with a very detailed documentation and very good examples so you can learn to generate charts pretty quickly.
List of supported chart types by Chartist:
- Bar Chart (stacked and horizontal including)
- Line Chart
- Pie Chart
- Area Chart
- Donut Chart
- Gauge chart
- Line scatter Diagram
- Animated SVG Path
- Bi-Polar Line Chart
- Timeseries
Features of the Charts Generated by Chartist:
- Extreme responsive configuration.
- Label placement
- Multi-line labels
- Overlapping bars for mobile
- Holes in data
- CSS Animation
- SVG Animation
- Advanced SMIL Animations
- Plugins support
How to use Chartsit to Generate SVG Charts?
Ther are multiple ways to use this library. Depending on what kind of frontend developer you are, you can use it. It comes as a Node module as well as embeddable script file that you can serve directly on HTML via CDN.
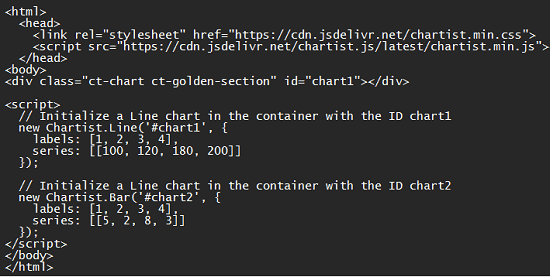
For simplicity, you can use this in HTML documents pretty easily. You just have to import these files in the <head> section of your website.
<link rel="stylesheet" target="_blank" href="https://cdn.jsdelivr.net/chartist.js/latest/chartist.min.css">

https://cdn.jsdelivr.net/chartist.js/latest/chartist.min.js
After linking the libraries, you only have to write a <div> element to specify the chart area on the pages. You can set a custom width for it if you want to. The height and width of the container depends on individual use cases.
<div class="ct-chart ct-golden-section" id="chart1"></div>
Now, add a script tag which will actually generate the chart in the specified container. This is actually very simple. If you know JavaScript very well then you can go through the documentation to see how to generate a custom chart. For demo purpose, you can just use the following code. Add it just below the <div> element that you have already created.
<script>

 new Chartist.Line('#chart1', {

labels: [1, 2, 3, 4],

series: [[100, 120, 180, 200]]

});

</script>
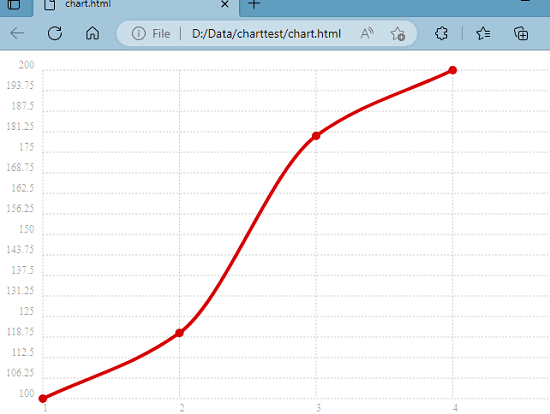
You are almost done now. Just open the HTML file in the browser. The chart will be generated now for you. You can play with the JS code to generate custom chart based on different data. Also, you can generate a different kind of chart in this way.
The documentation on the main Chartist website is very well detailed. It has many examples even on how to create animated charts. As a front-end developer, you will have to go through that documentation to generate a chart. And with some code, you can even make them exportable as well.
Closing thoughts:
I must say that Chartist is a gem of tool for developers and designers to integrate custom charts in staging as well as website in production. It is very simple and you don’t really have to write a very long piece code unless you are not creating some really complex. The GitHub repository already has more than 10K stars which is huge accomplishment in itself.