Here is a list of 5 free online radar chart maker. Using these websites, you can easily create some stunning radar charts for your data. They allow you to simply enter your data and then get them plotted on a radar chart automatically and in no time. These radar chart makers also offer various customization options using which you can make your charts look more meaningful and interesting. After creating a radar chart, you can also export it as an image, PDF, etc.
Creating a radar chart (also known as spider chart or polar chart) can help you display your multivariate datasets in a simple two-dimensional chart with several quantitative variables. The shape of a radar chart is updated automatically based on the data you enter or modify. This can come in handy if you want to compare multiple variables, display performance of different datasets, etc. You can read more about Radar Charts from here.
If you also like bar charts, then check out our post on 10 free online bar chart makers.
Radar Chart Maker (by Online Charts):
Radar Chart Maker (by Online Charts) is one of the best free radar chart maker which you can use to easily create beautiful radar charts online. It allows you to create a radar chart with as many items and groups as you want. It lets you manually add or import datasets and show them on the chart with different color codes.
To create a radar chart, just follow the steps below.
Step 1: First, open up “Online Charts” homepage and then select the “Radar” option from the list of supported charts. After that, you can choose the radar chart type (as simple or stacked) and style (background color, plot background, transparency, etc.). When you’re done, click on the “Next” button to proceed.
Step 2: Now, you can add the data which you want to display on the radar chart. For that, you can either upload existing data from a CSV file or manually enter them. If you want to manually enter the data, then you would need to define the number of items, number of groups, item names, item values, etc.
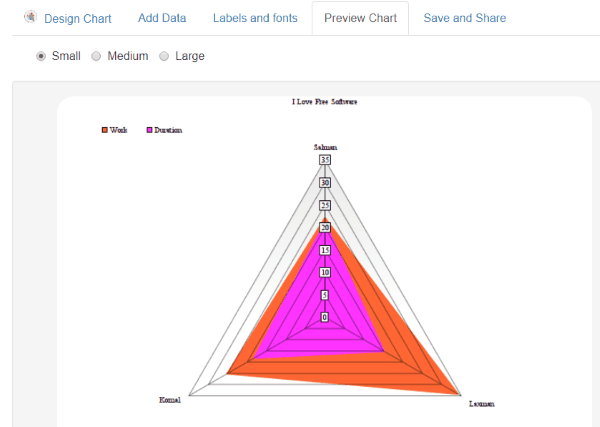
Step 3: Then in the next step, it will allow you to choose data labels and fonts. For “Data Labels”, you can enable or disable the “Show label” option, set prefix, suffix, axis, and numbers format. And for “Fonts”, you can choose the text font, font color, and font size. Once done, you can preview the radar chart and download it as an SVG, PNG, JPG, or PDF file.
Radar Chart Generator:
Radar Chart Generator is another online radar chart maker that helps you to create great looking radar charts for free. To do that, you would need to simply enter your datasets and the rest is done by this website. This one also lets you add unlimited items to the chart. It shows your data on a simple radar chart with circular grids.
You can create a radar chart by simply following the below steps:
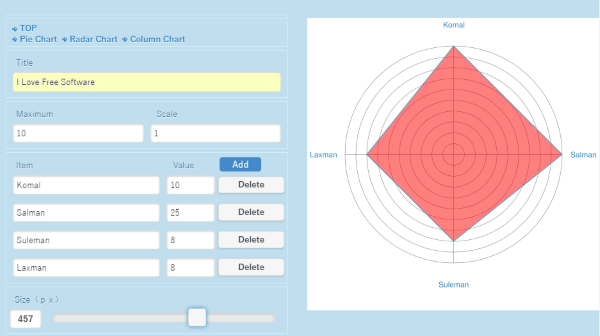
Step 1: After opening the website, you will see a blank radar chart on the right and the customization options on the left. Now, the first thing you would need to do is enter the title of the chart, select the number of circular loops and the scaling.
Step 2: Then you can proceed to add the datasets by entering the name of the items and the items’ associated values. You can add as many items as you want just by pressing the “Add” button. Then you can see a “Size” slide which can be used to define the size of the radar chart.
Step 3: When you’re done with that, you can see the preview of the output radar chart on the right. You can also download it as a JPG file to your PC. For that, you would need to click on the “Radar Chart Generation” button at the bottom and save it.
LiveGAP:
LiveGAP is also one of the best free online radar chart makers which lets you effortlessly create radar charts. You can simply enter your datasets on this website and then it will generate a beautiful radar chart for you. It also provides many customization options in this radar chart maker to customize the charts in any way you want. It even comes with a unique feature that lets you animate your radar chart and make it look more appealing.
To create radar charts using LiveGAP, go through the steps below.
Step 1: After opening this website, you will be asked to select a chart template from the list of pre-defined templates. You can find the radar chart template under the “Others” section. When you select it, the editor will open up and you can customize it in any way you want.
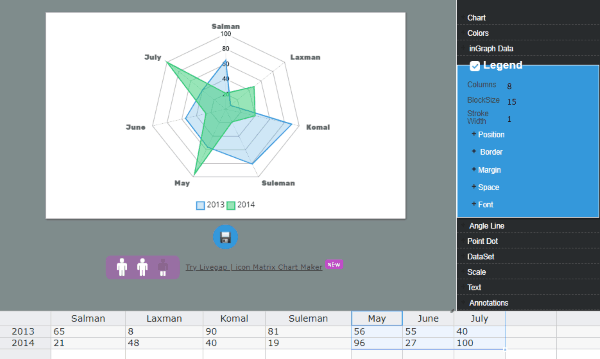
Step 2: At the bottom of the editor, you will see an Excel-like sheet on which you can enter your datasets. You can define the labels, item names, and their corresponding values. When you’re done with entering the data, you can proceed to customize the radar chart. On the right panel, you will see various options to edit the chart color, legend, angle line, point dot, add text, animation, and so on.
Step 3: After you do that, you can see the preview of the radar chart with your own datasets. Then you can save the output chart as an image, HTML, or get the embed code. This way you can create unlimited radar charts for free.
Charts Builder:
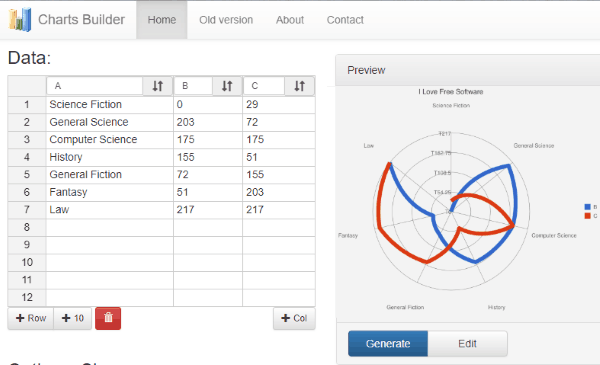
Charts Builder is also a free radar chart maker that you can use to easily generate radar charts online. If you have a multivariate dataset which you want to plot on a simple radar chart, then this website is for you. It allows you to add multiple series and then add as many items as you want to them with different values. After that, it will use the data to automatically generate the radar chart in no time.
You can generate radar charts by following the steps below.
Step 1: After opening this website, you would need to select the radar chart style. For that, simply click on the “change style of chart” link and then you will find the radar chart template under the “Line” tab. After you do that, you can see the option to enter your datasets.
Step 2: It lets you add as many rows and columns as you want and then enter your data (like items and their values) on them manually. At the bottom, you will also see the option to set the size of the radar chart. If you would like to customize the chart more, then click on the “Edit” button on the right and go to the “Customize” tab. There you can enter the chart name, change background color, edit axis, and the series on the chart.
Step 3: Once you’re done with editing the radar chart, you can see the preview of it on the right. It will display your datasets on the charts using colorful lines. After that, click on the “Generate” button and then it will create the radar chart for you. You can save it as a PNG file or get the HTML/embed code.
Google Sheets:
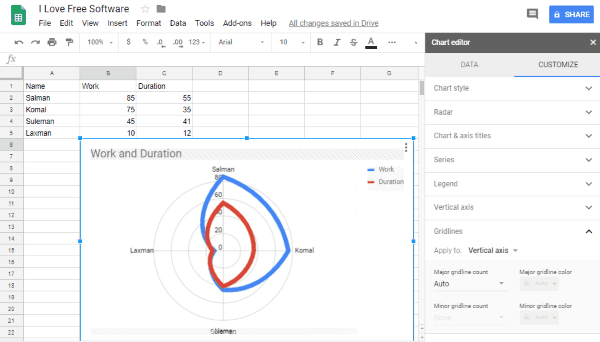
Google Sheets can also be used to create radar charts for free. Google Sheets comes with a built-in option using which you can plot your data on radar chart. To do that, you can simply enter your datasets on a sheet and then use the “Charts” tool to automatically create the radar chart. The charts created on Google Sheets looks exactly like the ones you can create using “Charts Builder”.
To create a radar chart using Google sheets, just follow the steps explained below.
Step 1: To get started, the first thing you need to do is add your data on Google Sheets. You can simply name the columns anything you want, enter items name on the first column, and their associated values on the other columns. For example, you can see the above screenshot on how to add the datasets.
Step 2: After adding the data, simply select all the blocks and click on the “Insert” menu at the top. Then choose the “Chart” option and select the radar chart from the available chart types. As soon as you do that, it will add a radar chart to the sheet which you can drag and place anywhere you want.
Step 3: You can also customize the radar chart in any way you want. For that, just click on the chart and then a popup window will appear on the right. On this window, you can edit the chart and axis titles, series, legends, gridlines, and data style. After you’re all set, you can go ahead and save the radar chart as a PNG image.
Closing Words:
If you have been looking for a way to create a radar chart with your datasets for free, then you should definitely try any of these radar chart maker websites. They provide an easy solution for you to create a radar chart by customizing it in any way you desire. The resulting charts generated by these websites look stunning. So, go ahead and start plotting your multivariate data on a radar chart online.
Try them out and leave your comments below.