In this article, you will read about how to insert charts and graph images in email, Notion, and Blog Posts for free using Charttt.
The graphical representation is the best way to represent a study or certain results. There are times when we send emails or write a blog, where we are required to represent data with numbers and percentage, there is not always the option to represent the data with a chart. While charts and graphs are a reliable way to present the data, the time constraints may not allow us to really create a graph every time.
The traditional way of creating a chart may require you to open an Excel sheet or Google Sheets and adjust the number there to produce a chart. However, you can use this new web application that can help you with creating charts and graphs images easily, which you can further use to insert in emails, notions, and blog posts for free.
Insert Chart and Graph Images in Emails, Notion, Blog Posts Free: Charttt
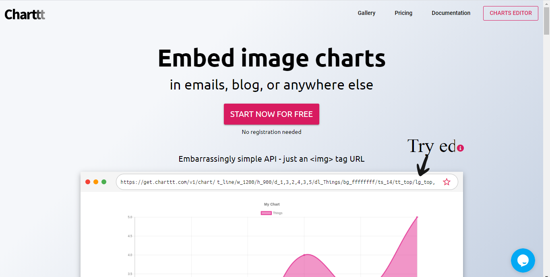
Charttt is a free web application that lets you edit the chart and graphs online that can be embedded in various places such as emails, Slack, Chatbots, PDF reports, Markdown Files, Blog Posts, Wix sites, and Notion. This web application provides you a free hand in creating different types of charts that can be used as an image or embed via code in the blog posts. Let us see how you can use this web application to your advantage.
For this, you can visit the website of Charttt by searching on the Google search engine, or simply click here to visit the website straight. After you visit the homepage, click on “start now for free” to get started. Here, you do not have to log in to use the service, if you do not directly want to embed the chart in the emails using this platform.
Upon clicking, you will be redirected to the page where you can edit the chart or graph as per your need. There is an input field given on the right-side panel where you can insert the value or points the graphs, and then edit the graph using the tools given on the left side panel.
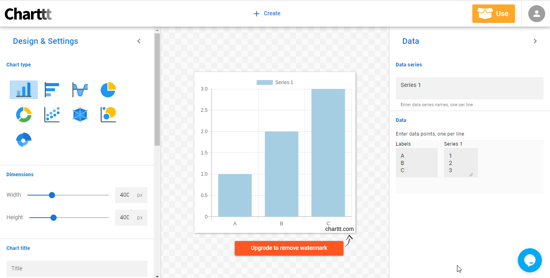
On the left side, you can edit the type of chart that you want to represent. There are 9 types of charts available with this service, including Line charts, Pie Charts, Bar Charts, Horizontal Bar Charts, Doughnut Charts, Scatter Charts, Bubble Charts, Radar Charts, Polar Area Charts. Use the one that is the best fit for your needs.
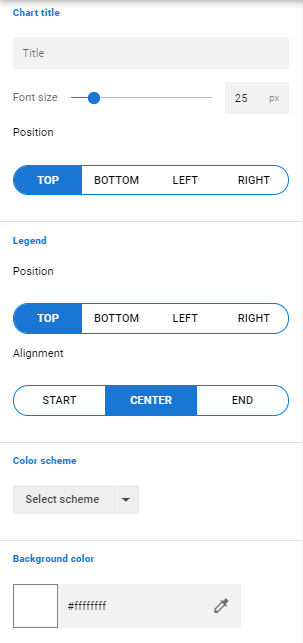
Moreover, you can edit the dimensions, font size, the position of the text, alignment of the text, and background color of the chart by using different tools on the left side panel. Edit the title of the chart on the left side panel field named “Chart title”.
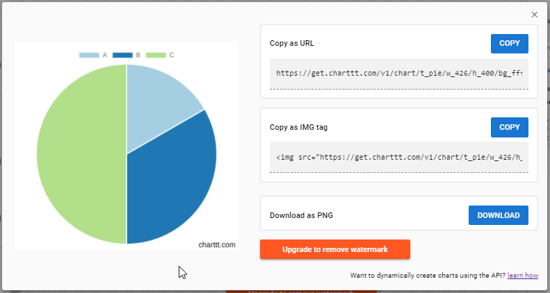
Once satisfied with the chart, click on “use” on the top right corner, and then use the chart however you want, like URL, Image tag, or simple a PNG Image.
In brief
Charttt is a simplified version of the excel and the Google Sheet if you want to quickly represent the numbers in the visible form on various online platforms.