This tutorial explains how to create animated charts in Jupyter Notebook. ipyvizzu-story is a free tool which serves as an extension of Jupyter Notebooks. Using this tool, you can create animated charts as slides. It can generate interactive charts that you can even export in HTML format and later embed on your websites. The animated chart that it generates is good for presentations and you can even play them in full screen mode as well as within the notebooks.
Usually, people use Matplotlib for creating or generating charts in Jupyter Notebooks. The charts generated by that library are good enough but they are mostly static and not interactive. But if you are going to present some data from Jupyter Notebooks then you will find this new extension I am going to talk below.
How to Create Animated Charts in Jupyter Notebook?
I am assuming that you already have Jupyter Notebook set up on your PC. That is why I am skipping the setup part for Jupyter. Let’s just start by installing the extension. Run the command in the administrator command prompt.
pip install ipyvizzu-story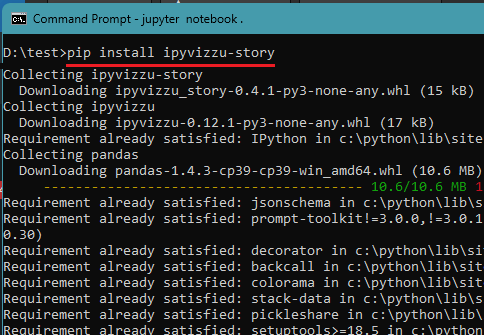
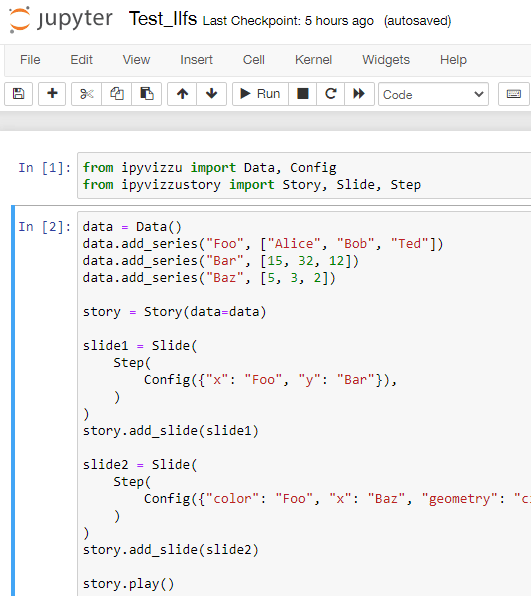
Now, launch Jupyter Notebook in browser and then create your first chart.
You can read the entire docs of ipyvizzu-story here. You will find sample charts with examples along with the usage. After learning from the example, you can simply create your code and then paste it in the cell of your Notebook.
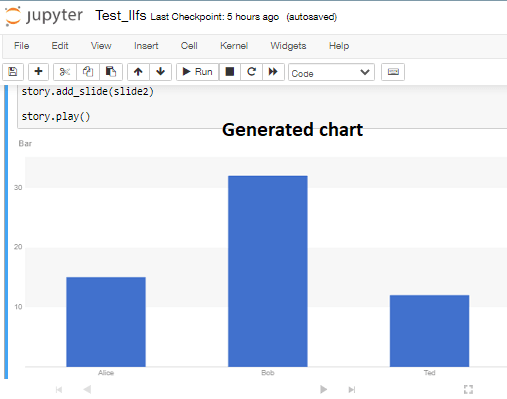
Execute the cell now and then wait for it to produce the chart. Depending on the hardware configuration of your PC, it will take some time. After that, it will generate the chart for you in the notebook. You can then navigate through the slides or see the chart in the full screen.
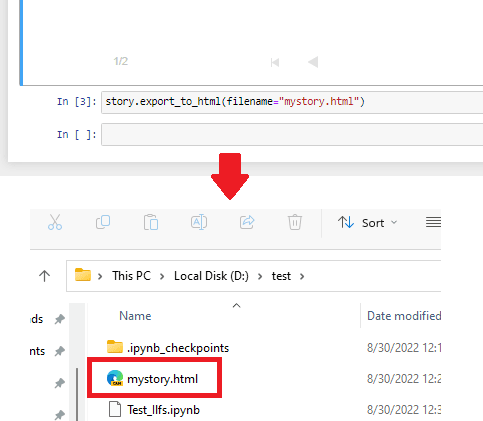
In the last cell, you just type the following code and then execute it. It will save the chart as HTML in the current working directory. And this way, you can use this module to create animated charts within Jupyter Notebooks with ease. You can use the generated HTML file anywhere.
In this way, you can create charts like presentation slides using ipyvizzu-story. Just install this module and then generate animated charts on the fly. What’s even best is that it lets you export the charts that you have generated in your notebook.
Fial thoughts:
For now, I have only tried Matplotlib so far on Jupyter Notebooks. But after seeing ipyvizzu-story, I am really amazed by its functionality. If you are a student from Data science or machine learning domain then I am sure you will find it really useful. Just install this module, go through the docs, and see it in action. Besides all this, it is an open source project and you can check it out on GitHub.