PerfMonitor is a free CPU benchmarking tool. With the help of this freeware, you are able to monitor 4 different parameters of processor performance. It supports a variety of Intel and AMD Processors. The Intel processors it supports are: Core 2 Duo, Core 2 Quad, Core 2 Extreme, Core Solo & Duo, Pentium M, Netburst based CPUs, Pentium 4, Celeron, Xeon. The AMD Processors it supports are: Athlon, Athlon XP, Duron, Sempron, Athlon 64, Athlon FX, Opteron, Sempron, Turion, Phenom.
You can also use PerfMonitor as a CPU comparison tool. PerfMonitor gives you the option of running as many instances of it in your PC as equal to the total number of physical CPUs in your system.

Using This Free CPU Benchmarking Tool:
Download this freeware from the link given at the end of this review. It is downloaded in the form of a zip file. The size of the zip file is 253 KB. Extract this zip file to a folder in your PC. It does not require any installation. Just click on its executable file and you are done.
This software shows various CPU related parameters in real time. It has 4 sections in which you can see 4 parameters at a time. This software provides lot of parameters, and you can choose which of those 4 you want to monitor on the main interface of this software.
Before getting started with this software, it is important to have a basic idea about what do these different parameters mean. Here is a brief info about those.
List of CPU performance parameters supported by PerfMonitor:
- Non-halted clock cycles: Non-halted clock cycles are the number of clock cycles continuously executing instructions of logical processor.
- Retired Instructions: Retired Instructions are the number of instructions which are completely executed.
- Cycles per Instruction: Cycles per Instruction mean number of clock cycles per instruction
- Instructions per Cycle: Instructions per Cycle means number of instructions per cycle.
- Bus clock cycles: Bus clock cycles mean number of data transfers per clock cycle.
- Retired branches: retired branches mean number of retired branches instructions.
- Retired mispredicted branches: Retired mispredicted branches mean number of retired branch instructions which are wrongly predicted.
- Branch Prediction success rate: It means rate of success of branch prediction.
- Retired uops: It means uops which are retired.
- uops per cycle: It means number of uops per instruction.
- Retired fused uops: It means number of fused uops which are retired.
- Retired non-fused uops: It means number of non-fused uops which are already retired.
- Last level cache requests: It means cache request at the last level.
- Last level cache misses: It means attempt which is failed to write or read data in the cache.
- Last level cache success rate: It means the success rate of last level cache.
- Memory bus transaction: It means those bus which connect the memory to the DRAM.
- Indirect branch instructions executed: It means total number of indirect branch instructions which are executed.
- Instructions decoded: It means instructions which are already decoded.
Choose which CPU Parameters you want to monitor:
As I mentioned above, you can choose any four CPU parameters to monitor. For that, right click on any of the four events showing in its main windows and you see the following menu.
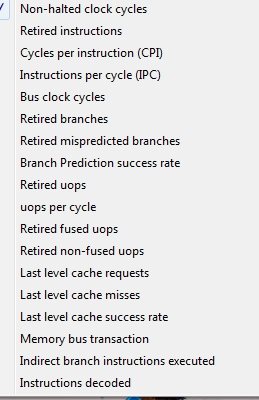
Just select the parameter that you want to monitor, and that section of PerfMonitor will start showing real time values for that parameter.
Here I clicked on “Non-halted clock cycles”. And it shows you non-halted clock cycles.

Similarly by right clicking on any of the four events running in its main windows, you can view a variety of parameters.
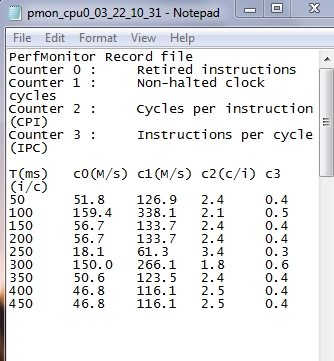
This software also lets you record the events in a text file. You need to press key “F5” for that. It saves the text file on the desktop.
My Opinion About PerfMonitor:
PerfMonitor is a nice freeware for CPU benchmarking. This application is definitely not for beginner or even mid-level users; they won’t even be anle to make sense of what this application displays. For normal users, I would recommend trying tools like Prime Benchmark, or other PC benchmarking software.
For advanced users who can interpret the data displayed by this application correctly, this application can turn out to be quite useful.