Mapipedia is a free website for geospatial time series data visualization. Here this websites has a lot of time series data submitted by various people for a specific geographical region. Here you can search for a dataset and then visualize it. Datasets for population stats, Famine & Disease, Soviet Famine, Spanish Flu, Rwandan Genocide, and some others can be found here. You just search for it and then analyze it. And the best part is that here you can submit your own datasets that you have and let others view it. For the data visualization, it offers you animated heatmaps that you will like and you can download the data you are currently viewing in CSV format too.
Time series data can be related to anything. But here this website only supports datasets about a particular geographical area or about the whole world. The website comes with the free and paid tier and in the free plan, you can create unlimited public pages of you own and opt to receive donations as well. You can create your own geospatial data by uploading that on the website through a CSV file and share that with other members. Others can like your data and even follow you.
Using Mapipedia to for Geospatial Time Series Data Visualization:
Mapipedia is currently emerging and there are not so many users as well. In the free plan, it lets you create 5 non private pages and unlimited public pages. CSV upload size is kind limited in the free version as well but good for creating and sharing some small datasets that you have. Also, it offers you a website’s search that you can use to discover datasets that others have submitted. You can see datasets by others and analyze them by playing an animation. After you have analyzed something, it even lets you download that.
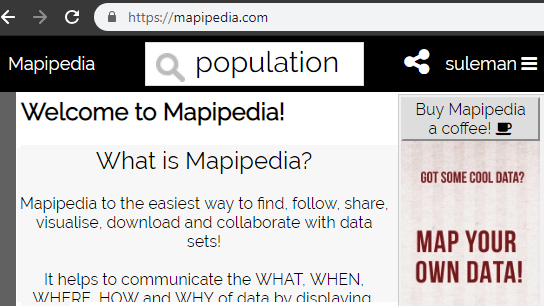
The first step is to sign up for a free account for this website. After that, login and use the search bar to look for some datasets. Enter a search term and corresponding data will be displayed.
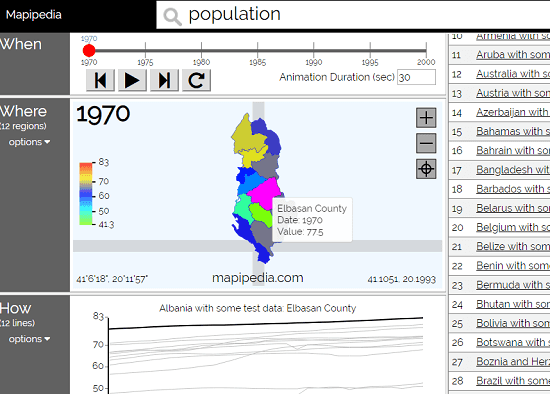
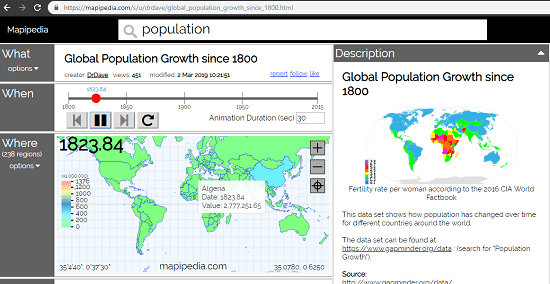
Select any dataset and then see its page. You can see a lot of details about it and there is a map as well to analyze that using animated heatmaps. You can hit the play button for animation to being and then you can download this data as well.
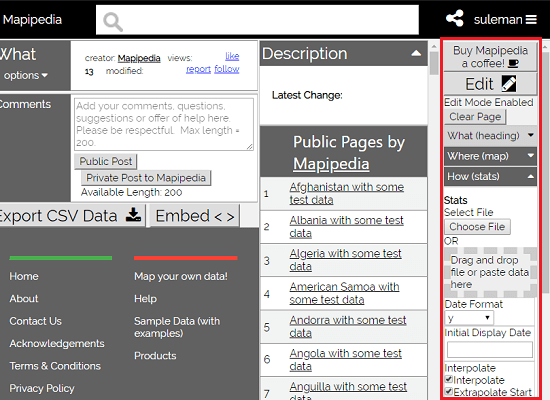
To create and share your own mapped data, you go to Map your Own Data section and then go through the steps given there. In steps by step manner you can upload your data from your PC and create page. You can customize a few things as well there such as adding comments, heading, and some other things.
By using this website in this manner, you can create and share your own spatial time series data with others. Also, you can browse through data by others and then do whatever you want. If you want to create more non private pages then you can upgrade to its paid plan as well.
Final thoughts
Mapipedia is a very good websites for data scientists and researchers which often deal with such type of data. You just search for a dataset or simply create your own. The interface for the data visualization is very nice and interactive, You can create some of professional work on this website as well as it supports private pages. Otherwise, you are free to create unlimited public pages. If you want more private pages then you can subscriber to any other tier and do whatever you want.