This article covers a simple method to plot spreadsheet data in Google My Maps. Google Maps is the most popular and accurate publicly accessible map on the internet. Google has built many services around the map and also offers different types of integrations as well. Google My Maps is like a custom version of Google Maps which you can customize in various ways and create new maps.
If you have a spreadsheet with location data (places or coordinates), you can plot that data on the map. You can directly import the spreadsheet files to your My Maps and then pick the location column that you want to use for mapping. When you do that, all the location data from your spreadsheet gets plotted on the map which you can save online or export to the KMZ file.
Also read: Free Google Sheets based CRM to Track Sale Opportunities
How to plot Spreadsheet Data in Google My Maps?
To plot spreadsheet data in Google My Maps, you are going to need a Google account. Open the Google My Maps on your browser and sign in with your Google account. It shows you all the custom maps you have creates so far along with a button to create a new map. Tap that button to create a new map and add a name for it.
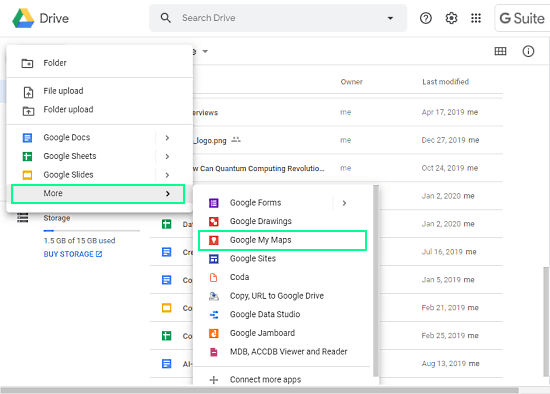
Alternatively, if you are on Google Drive then you can create a new map from there as well. To do that, click the “Create” button in Google Drive and click ‘More’ to get more options. Then, choose the “Google My Maps” option to create a map.

When you create a new map in Google My Maps, it opens the map with an info pane on the left. From the pane, click the “Add layer” option to create a new layer and name it. When you create a layer, an “Import” option appears below it that allows you to import the map data for the layer.
With this option, you can import your spreadsheet file to the map. Apart from the spreadsheet, it supports CSV, KML, and GPX files as well. You can either upload the file from your computer or browse it from your Google Drive.
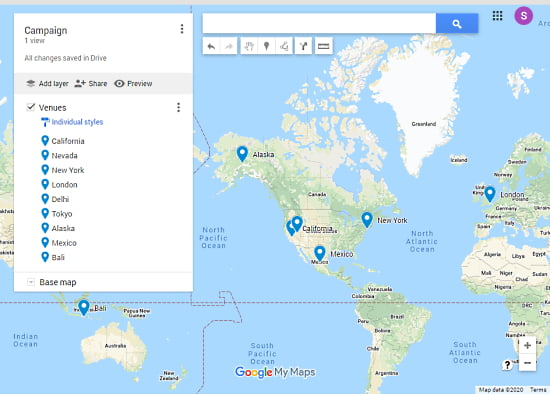
When you import the file, a popup opens on the screen where you have to pick the spreadsheet columns that you want to plot on the map. After that, another popup opens where you can pick a title column for all the markers. Once done, your spreadsheet data is plotted on the map along with your custom names for the markers.
The map is automatically saved to your Google My Maps account and you can also print it or save as PDF. If you want to use the map with other apps, you can download export the map to a compatible KML/KMZ file which you can use with any mapping application.
Closing Words
This is how you can plot spreadsheet data to Google My Maps. You can use this method to visualize your spreadsheet location data on the map such as store locations, distributors, favorite places, etc. Give it a try and do share your thoughts in the comments.