ThoughtSpot is now offering a free Google Sheet plugin that lets you visualize data from the sheet. It can create graphs using different charts and then you will get a better view of the data to make certain decisions. It can automatically grab all the data from the current sheet and categorize it as well depending on its type. You just have to select two or more attributes to generate the chart.
Often times, when you want to visualize some statistical data then built-in charts can be complicated as you have to spend some time to specify the chart type and tweak few other parameters. But ThoughtSpot here lets you do that in just two clicks. You can run it on any sheet and then it will do its work automatically. However, for now this tool focuses on data visualization. You will not be able to export the generated charts.
Free Google Sheet Plugin to Visualize Complex Data using Charts
ThoughtSpot comes as a Google Workspace plugin. You can install it from here and then add it to your Google Sheets in your account. During installation, it will ask for some permissions, so simply give them.
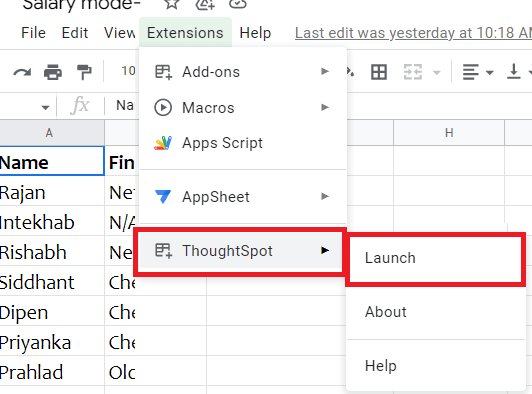
Now, you are all ready to use it. Open any Google Sheet that has some data that you’d like to visualize. After that, you can just simply activate this plugin from Extension > ThoughtSpot menu.
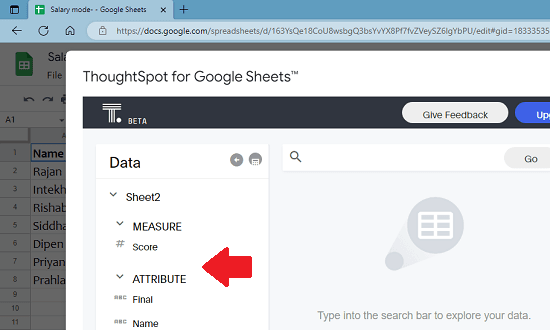
Now, it will open a popup and will load the sheet data from it. From the sidebar, you can see that it will show you the columns names as attributes. You can see it in the screenshot below.
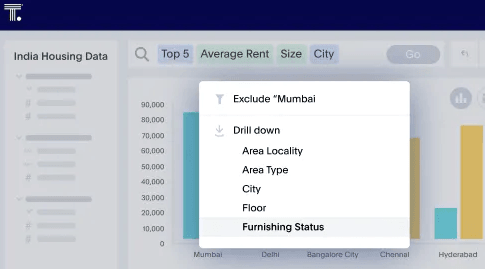
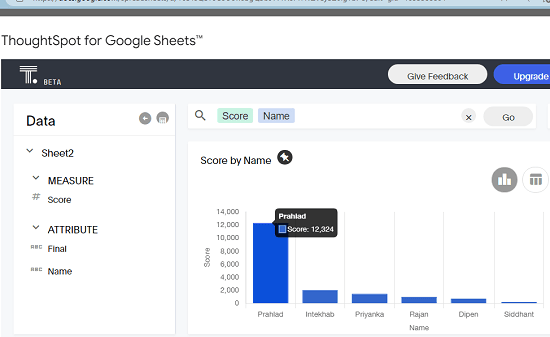
Click on 2 or more attributes that can be shown as graph. After that, it will automatically generate the chart for you that you can analyze. You can keep swapping the attributes of the chart and it will adjust automatically.
In this way, you can visualize any data in Google Sheets with the help of ThoughtSpot. Just activate the plugin on a sheet containing data that can be visualized via graph. There is no limit on how many times you can use it.
Final thoughts:
If you are looking for a simple and free Google Sheet plugin for data visualization then you are at the right place. ThoughtSpot here is a very good option as it generates interactive graphs and charts. I found that free version is good enough when it comes to data visualization. But if you need more then you can always try the premium version.