Algorithm Visualizer is a free web application where students can test and learn important data structure algorithms through step by step visualization of the algorithm. Users have to code the main algorithm as well as define the data structure’s illustration code. When the code is run, one can visually see the algorithm in action.
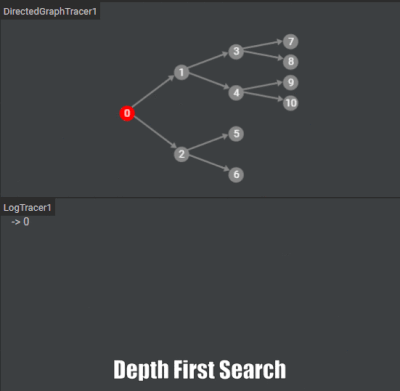
There are mainly two types of data structures visualized in Algorithm Visualizer. The first is the array which can be multidimensional and the second is the graph. Graphs can be directed and also weighted.
There is another app that will help you develop algorithms. Make sure you check out Textografo. Textografo helps you speedily make flowchart of an algorithm through coding the same algorithm.
Let’s have a better look at Algorithm Visualizer.
How to Visualize Algorithms using Algorithm Visualizer
Algorithm Visualizer is a really seasoned application that not only codes your data structure programs but also highlights the steps taken to do so. On one part of the screen you’ll see the output being generated and on the other you’ll see the changes being made to the data structure you are using.
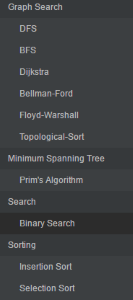
On the Left you can see a list of data structure algorithms that annoyed me a lot in my programming classes. These algorithms include neatly categorized sorting algorithms, graph search, minimum spanning tree, etc.
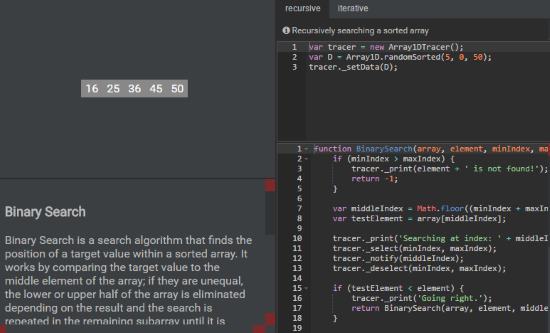
Click on the desired algorithm you want to test and study. The middle portion of the screen draws the array declared in the code. Below it you can see the complexity of the algorithm in O notation. The top panel on the left is where you declare the data structure type. Here is the code used to define an array with 5 random elements between 0 and 50:
var tracer = new Array1DTracer();

var D = Array1D.randomSorted(5, 0, 50);

tracer._setData(D);
Similarly if this array was a weighted and directed graph, we would use the line:
var tracer = new WeightedDirectedGraphTracer();
On Algorithm visualizer, I had a look at the binary search algorithm that searches a given element in a sorted array. Binary Search compares the element it is searching for with the middle element of the array. If they’re not equal, control moves to the upper or lower half of the sorted array if the middle number is lesser or greater than the searched number. It repeats the same with that half till the searched number falls in on the pointer. Students can check out the code to understand the algorithm. Click on Run to start the Binary Search animation.
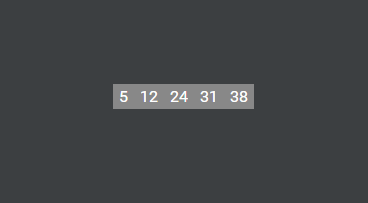
The animation will show you the whole array highlighted blue followed by the red pointer starting from the middle of the array on 24. The number we are looking for is 31. 31 is greater than 24 so the right half is selected. the middle element of the right half is 31 itself so the algorithm stops. The output below will look like this:
Using Binary Search to find 31

Searching at Index: 2

Going Right.

Searching at Index: 3

31 is found at position 3!
Try building an algorithm from scratch on Scratch Paper at the bottom of the algorithm list under Uncategorized.
Final Words
I wish I had Algorithm Visualizer in my school days since I found it difficult to memorize many important algorithms for my tests. This tool will definitely help young potential programmers to understand the complex code and algorithm of sorting, searching and shortest path algorithms. I did not come across any bugs or errors while using this wonderful web app but I wish I could use multiple arrays in a program. I give Algorithm Visualizer 5 stars.
Try Algorithm Visualizer here.