Process Sandlglass is a free application to measure uptime of various programs and processes that computer runs. It gives you a really good overview of process uptime that you add to Process Sandglass for tracking. It does so by providing you a statistical study and calculations of the uptime of processes that it shows in graphs and pie charts.
So many of you might be wondering what uptime is? Uptime, simply put, is the time since a process has been ‘up’ and running. Knowing the uptime of a process basically tells a lot about the process’s impact on the performance of your computer. In cases of servers, knowing the uptime of server processes will help you manage the servers better. Process Sandglass helps you track everything.
On Process Sandglass, you can selectively add processes that you want to track and leave out the ones you don’t want to. You can add uptime checkpoints and the statistics will be measured over 3 time ranges, namely hours, weeks and months. You will be provided with data charts for all these 3 ranges with peak facts about them.
So lets take a better look at Process Sandglass. You can also check out these 23 free process viewers to help you manage your computer processes better.
How to Add a Process for Tracking on Process Sandglass
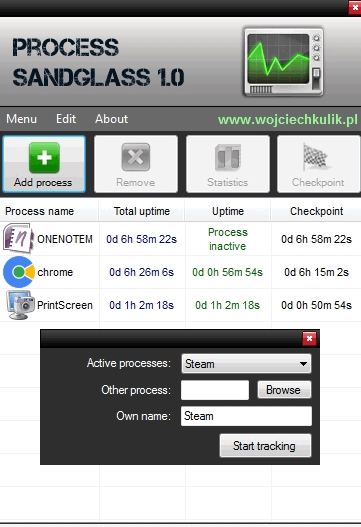
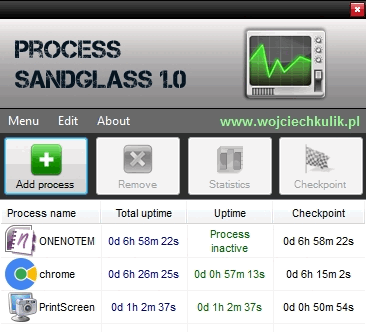
When you open Process Sandlglass, you’ll see a ribbon of big menu buttons. Among them, is Add Process. Click Add Process to add a process from az list of processes that are running on your system at that very moment. You can select Active processes from a drop down menu. You can also rename the process so you can differentiate between different instances of same process. To delete a process, select the process and hit Remove from the menu. You can also add a ‘checkpoint‘ from the menu which acts as a time marker for your process’s uptime.
How to View Uptime Statistics of a Process on Process Sandglass
Select a process and click Statistics to view the uptime statistics of a process. By default, you will see a bar chart of the process in ‘daily‘ mode. It shows for how much time the process has been running (in minutes) over a span of days. You can select a month from the drop down menu. It also shows the longest uptime till now and the longest uptime in the day. You can select an iteration from the list provided.
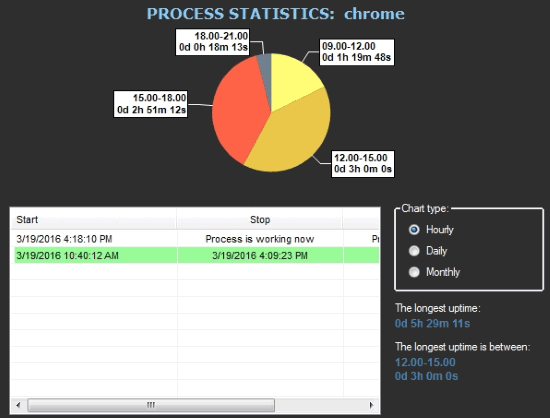
Switching to Hourly will show you the uptime pie chart. The pie chart will be divided based on the hours that have been spent. It will also show you the hours between which there was the highest uptime.
If you go to Monthly, there will be a graph of uptime in days over months. You can select the year from the right. It will also show you the overall longest uptime and the longest uptime during a day.
Other Settings of Process Sandglass
You can choose to run Process Sandglass at startup, launch it in system tray and keep it pinned on the screen from the Menu at the top. Select the one you want.
Final Words
This is a really good software that shows you uptime of processes running on your system. This is especially useful for system administrators. I give Process Sandglass 5 stars.
Get Process Sandglass here.
Know a better alternative to Process Sandglass? Share it in the comments!