markvis-editor is a free online tool to make custom charts from markdown. With it, you can easily draw 3 types of charts i.e. line, bar, and pie charts. The best part is that it is super easy to use; you just need to edit the predefined markdown code to instantly draw these infographic charts. However, the main limitation is that there is no native option to export these charts. So, in case, you want to export the designed charts, then you need to capture a screenshot. Previously, we reviewed Chartico– a free online tool to create bar charts but it gave you the option to download the designed bar charts as JPG images. Also, it offers a lot of customizability. In markvis-editor, you just need to play with the markdown code in its editing window to get your charts designed automatically. There is also a similar service named TinyChart which can be used to automatically design charts based on tabular data. Another good thing about this free online chart generator is that it is completely open source, you can check it out its GitHub repository from here.
How to use this online tool to make custom charts from markdown using markvis-editor:
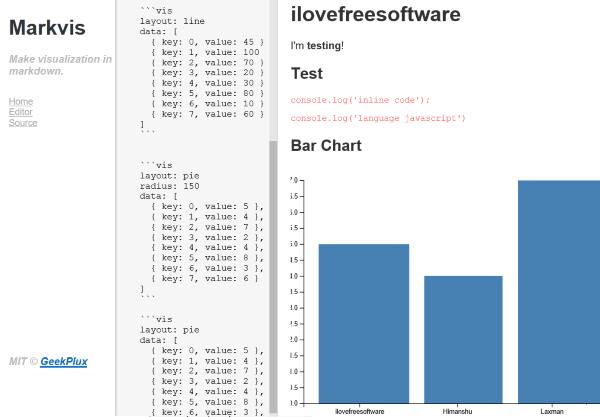
Getting started with markvis-editor is pretty easy; just visit the link at the end of this review and then edit the markdown code to design custom charts. There is no need to sign up or login; simply go to the link to access its editor interface to draw bar, line, and pie charts. Its main interface is basically divided into 3 sections. The leftmost section simply displays the logo and basic navigational menu. The markdown code editing section is at the center and the charts are displayed on the right section, as shown in the main screenshot. Now, in order to generate charts, all you need to do is edit this predefined markdown code. The code is divided into 3 sections and each code section is used to generate a specific chart type. The code to generate a chart is written in ““`vis code to generate chart “`” block. You just need to specify 3 parameters within this block to get your chart automatically generated, as explained below:
- Layout: Chart type to generate i.e. line, pie, or bar. Note the code snippet to specify chart type for each of these charts:
- Line: layout: line
- Bar: layout: bar
- Pie: layout pie
- Radius: To be specified only for pie charts. Follow this syntax to define radius “radius : 100”.
- Data: This is the most important entity of the code as based on this data the chart will be generated. Data can be defined in key-value pairs, where key defines a new entity in the chart and value is its magnitude. In order to define data, follow this syntax:
data: [
{ key: entity name, value: magnitude },
{key: entity name 2, value: magnitude 2},
.
.
and so on,
]
Now, that you know how to define chart type and data, you can combine all code snippets together, which will look something like this:
```vis

layout: line

data: [

{ key: 0, value: 45 },

{ key: 1, value: 100 },

{ key: 2, value: 70 },

{ key: 3, value: 20 },

{ key: 4, value: 30 },

{ key: 5, value: 80 },

{ key: 6, value: 10 },

{ key: 7, value: 60 }

]

```
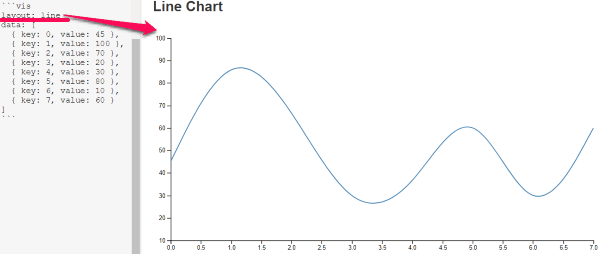
This markdown code will generate a line chart as shown in the screenshot below. In case you don’t want to do so much of hard work yourself, then you can also just modify the existing markdown code and copy/paste markdown code to generate custom charts. Just modify the key and value inside the data block of the code and charts will be updated in the real time.
Finally, when you have generated your charts, you can take a screenshot to save them, as it doesn’t provide the option to download them as images.
Verdict:
markvis-editor is a free online tool to generate line, bar, and pie charts from markdown code. You just need to specify the layout type and then key-value pairs to generate charts automatically. I would have really given this tool 5 stars if it provided the option to download the generated charts as images. Still, I can recommend it if you want to quickly generate some simple infographics using line, bar, or pie charts. Check it out from the link below.