This post here lists 3 free bar chart race generator tools. Here I have added some online as well offline tools that you can use to generate a bar chart race and use them anywhere. The tools here take a dataset from you to plot the animated chart and generate a GIF or a publishing the chart on a specific link. You can generate as many bar charts race you want and use them. I have also added some open source tools to the list that you can use locally and even host them on your own server.
A bar chart race is an animated bar graph(can be vertical or horizontal) and it usually shows the increment/decrement in some quantity over time. The animation is what makes the entire chart looks like the values are racing. You can see an example of a bar chart race in the GIF that I have added below. And you can generate one from your own data that you usually supply in CSV/Excel format. Apart from showing the data, you can also customize the look and feel of the chart using the controls that these tools offer.
3 Free Bar Chart Race Generator Tools
Flourish Studio
Flourish Studio is one of the best free online bar chart race generator you can use. Here it takes the chart data from your in CSV/TSV/Excel format and then generates the final chart. It lets you host the animated chart that it generates in a unique URL and offers a corresponding embed code. However, in the free plan, you cannot download the chart on your PC. For customizing the bar chart race, it offers you various customization tools and a data editor which behaves lie Google Sheets. You can fully customize the tabular data in order to generate a perfect bar chart race.
Using Flourish is very easy. You just go to the homepage and then create a free account. Next, from the main dashboard, you create a new project and then choose the chart type. It offers you a lot of types of charts, since in this post we are talking about bar chart race, so just choose that.

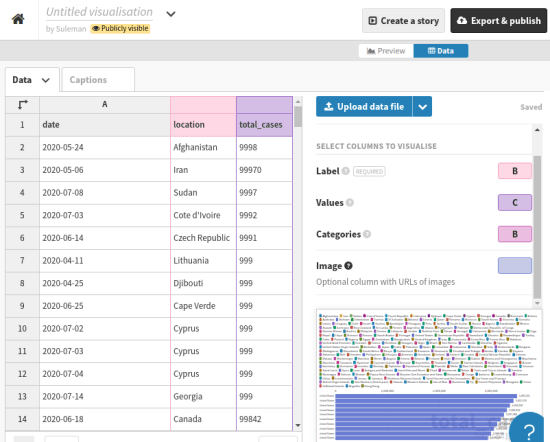
Now, it will take you to the chart editor. Just edit the template and upload your data set. The data set file after being uploaded successfully will be available in the sheet editor. You can now specify what colors and columns you want to choose for the final animated chart. All the controls to do that are available on the right hand side. Just tweak the data and save it. You can even see the preview of the final bar chart race and then adjust the data again if you are not satisfied.
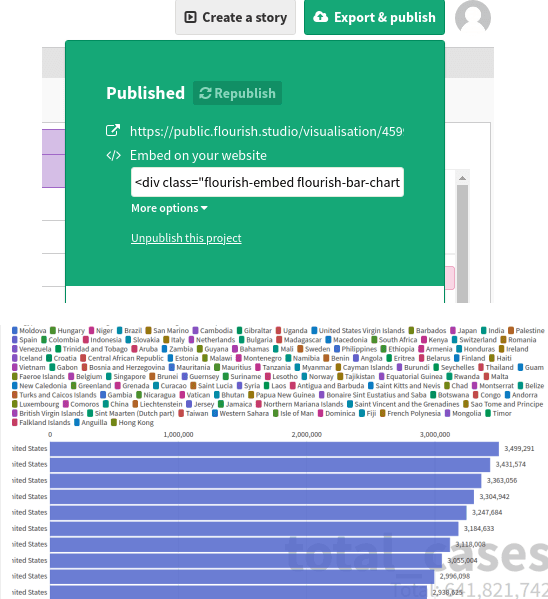
Finally, you publish the chart ad it will give you a link. You can share that link with anyone whom you want to share that chart. Also, it gives you an embed code in case you want to showcase the graphical representation of the data on your own website.
In this way, you can use this simple and quite straightforward service to create and publish bar chart race. You can fully customize the generated charts from labels to colors. There are some other parameters that you can tweak and all of them are available in the chart settings. And not only bar chart race but you can use this services to create almost any kind of chart and publish.
Bar Chart Race Generator by FabDev
This is another tool that you can use to generate a bar chart race from CSV data and showcase that on your website. This is an open source tool and the entire code base is available on GitHub. Here it has a simple UI where you just submit CSV data set and it will generate the bar chart race for you. This is a very straightforward tool and it offers you some pre-ready datasets already that you can use. The bar chart race that you generate with this can be added to your website and then you are free to do whatever you want. This is as simple as that.
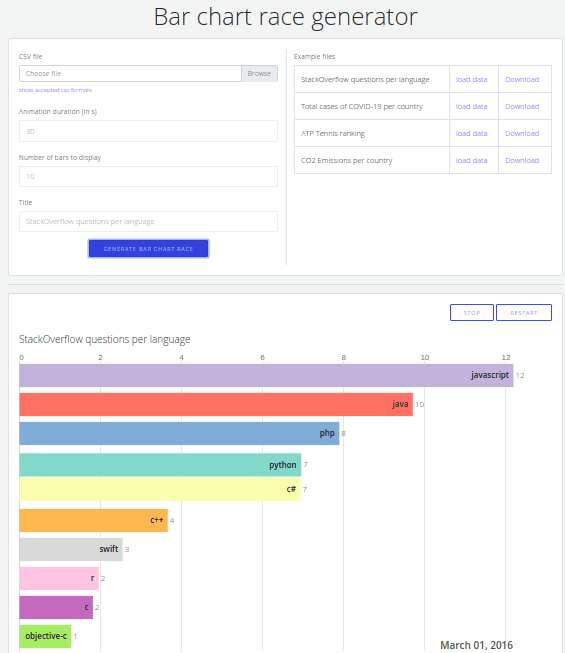
Getting started with it very easy. There is an online version hosted version of the tool already available where you can give it a try. You can o there from the link above and then select any available database. But when you want to use it on your website or server then you will have to supply your own dataset. There are no customization options for now but I hope in later updates they add that. Also, you can go through the documentation to learn more about the data set and how to use it. Also, for the technical specifications, you can go through its code.
Bar Chart Race using Matplotlib
Bar Chart Race using Matplotlib is the last free tool that I could find and this one can be used locally. Here it is basically a Python library but you can create a simple script based on the one that it already offers. Just like other tools above, it takes a dataset from you and then generates the corresponding bar chart race. The only difference here is that it generates GIF or MP4 file as an output. This is open source as well and the animation that it generates is really amazing. There are few things that you can customize and you can easily integrate in your Python projects.
Installing this tool easy on your PC no matter if you are on Windows, MAC, and Linux. You just run the command below and then wait for the installation to finish. You have to make sure that you have git and Python already installed before executing this command. Here you will also have to install ffmpeg.
python -m pip install git+https://github.com/dexplo/bar_chart_raceNow, you just copy this script from here and change the dataset. If you are just using it for testing then leave all the parameters as they are.
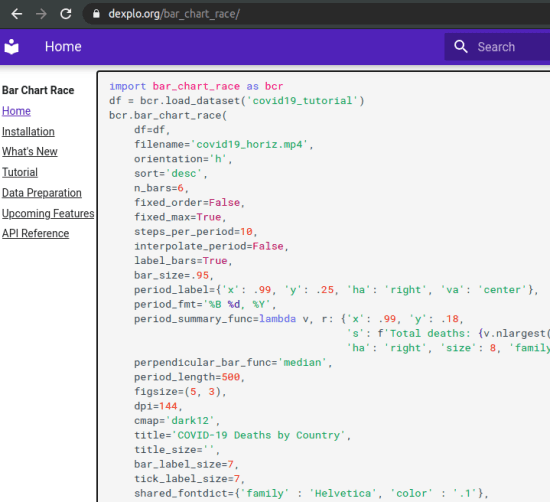
Now, you just execute the script as below and wait. In the end, it will generate GIF with the bar chart race. You are now free to use that GIF anywhere you want.
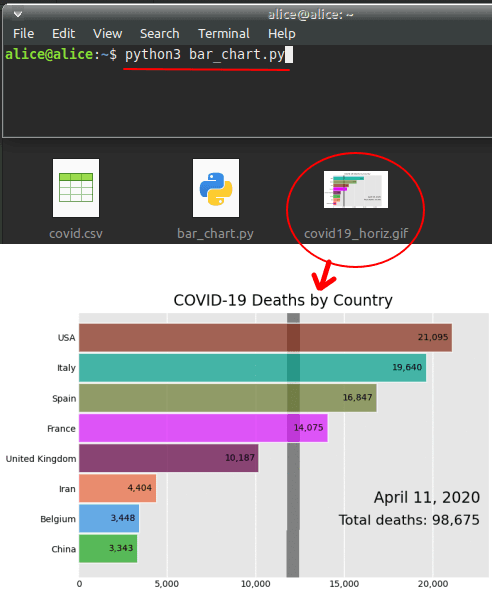
In this way, you can use this simple and offline tool on your PC to generate bar chart race. There is official documentation about this tool as well as it lets you customize the final bar chart race. There are a lot of parameters that you can tweak in the script and you can also learn about the advanced usage. This works best with Python and if you are running heavy backgrounds apps while using this tool then it may hang your system. So, I will advise you to use it on a PC with high hardware configuration.
Final words:
These are the only free tools that I could find to generate bar chart race. All these tools do what they say and generate a pretty nice animated bar chart race. If you have some data that you want to show based on different time periods with animation then you can use any of these. However, the use case depends on different situations, If you want to host the bar hart race online then use Flourish Studio. If you want to generate a bar chart race. If or video offline then use the one with Python.