Falcon by Plotly is a free and open-source SQL editor with data visualization graphs. Here it supports some most popular types of databases such as MySQL, SQLite, MariaDB, Spark, and some others. You can connect to these databases with ease and run SQL. The best part is that it lets you visualize SQL output and you can also export the data in CSV format. For visualization, it supports so many types of graphs that you will like. You can easily create a line graph, a pie chart, a scatter plot, an area graph, and so many others. Another nice option in the tool is scheduling to run a SQL at a specified time.
There are many SQL editor software already and you can use them with but they don’t really come with the visualization feature. If you want to visualize SQL data you are working with then you can use the Falcon software mentioned here. You just connect to the database and then you can simply start running SQL queries to get the data and plot that. The software has tabs and you can work with multiple databases a the same time with this. However, you need to make sure that you system is not running low on resources, otherwise working with huge databases will no be very smooth.
Free SQL Editor with Data Visualization Graphs: Falcon
Falcon is also a cross-platform software and works hassle-free on Linux, MAC, and Windows. If you t take part in its development or want to peek int its source code then you can take a look at its GitHub page. For trying it out on your PC, you can download it from one of its releases from here.
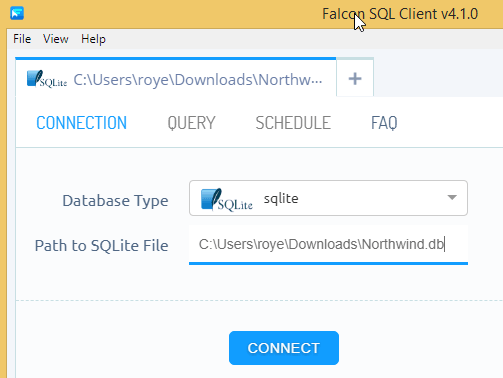
After installing, you can just start using it to connect to databases. On the very first page, you will be asked to select a database to work with. It supports many databases and you need to make sure that the database server is running on your machine that you want to work with. In my case, I am using an SQLite database for testing purposes.
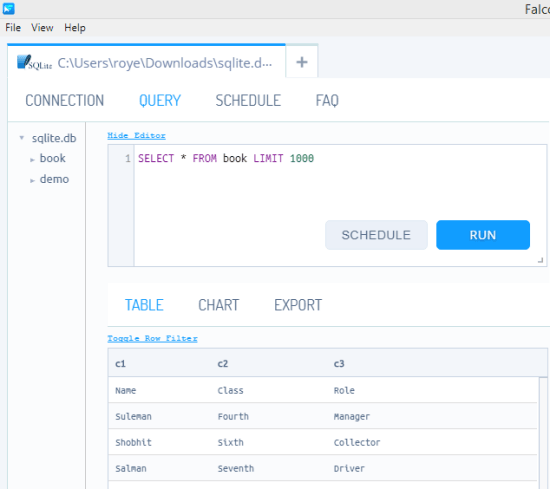
So, after specifying the connection details, you can just move to the “Query” section. There, you can run SQL commands and see the results. The SQL editor there is very nice and has syntax highlighting with suggestions. You can execute the query there and see the result and even opt to export that to a CSV file.
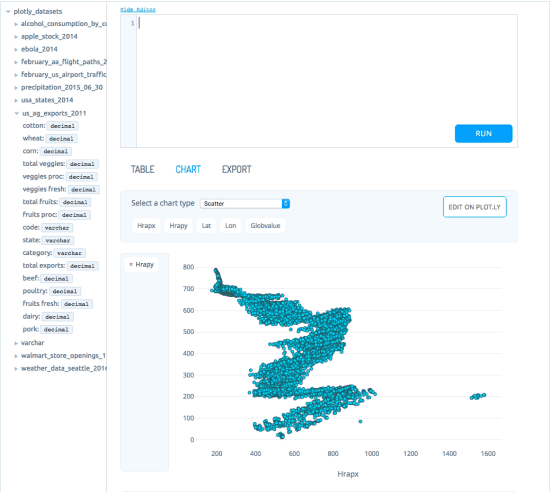
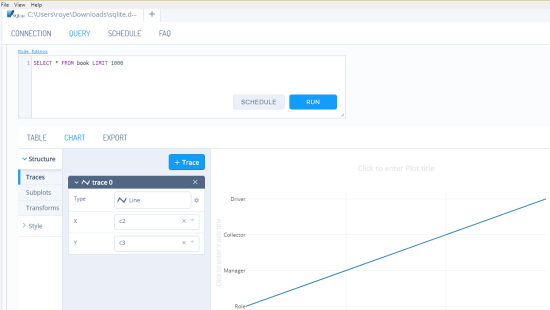
Next, if you want then you can opt to make a graph for visualization from the data that it has generated. For that, you select a graph from the list and then map the dimensions that you want to use for the graphs. After that, it will automatically plot that for you. This is as simple as that. You can choose from a variety of graphs that are available there and then just plot them.
This is how you can use this simple and powerful SQL editor software to run SQL queries and plot the output for visualization. Generally, you have to use multiple tools for the same set of features that Falcon offers. Here you just get data in any form using SQL and visualize that using various kinds of graphs, For example, you can use it to query population data and them plot that on scatter plot to see population distribution on a certain region. And here you can work with multiple databases at the same time, this is the second most amazing thing about this software.
Closing word:
If you are looking for a powerful SQL editor for desktop then Falcon is one of the best tools you can use. I liked the simplicity of the software and the amazing features that it has. It is open source and if you are from a programming background then you can even customize it according to your needs. Overall, the interface is nice and you can easily use it in the same way on any platform you want.