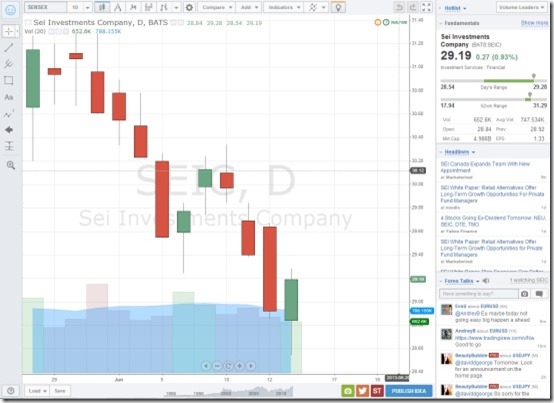
TradingView is a website to generate free stock charts that provides you real-time stock chart along with market news, chart types, drawing tools and much more. It is a kind of social trading world which enables you to view and create real-time stock charts and lets you to insert multiple indicators. It lets you to share an idea on social networking sites and provides you real-time conversation features.
TradingView can be easily accessed in any web browser as well as on any device. It involves the latest HTML5 technology and cloud computing for real-time stock charting. It lets you publish your trading ideas and allows you to take instant chart snapshot that can either be saved or paste it into chat, document, etc.
Stock Exchanges Supported by TradingView:
TradingView supports many stock exchanges all over the world. Following stock exchanges are supported for free:
AMEX, CBOE, CBOT, CME, COMEX, NASDAQ, NYSE, TSX, TSX Venture, Eurex, NYMEX, ICE USA, ICE Canada, ICE Europe, KCBT, MGEX, NYSE LIFFE, MICEX, FORTS
In addition, it supports a few additional stock exchanges, but you need to pay for that ($19.95 per month). When you upgrade, you can access data from following stock exchanges as well:
AMEX, NYSE & NASDAQ
Key Features Of Website to Generate Real Time Stock Charts:
- Provides you real-time free stock charts
- Lets you access from anywhere with an internet connection
- Enables you to view your stock chart in different types of chart format
- Provides indicators for technical popular studies
- Provides multiple timeframes to see long-term and short-term data
- Provides you drawing tools like Trend lines, Pitchforks,etc.
- Provides you social tools like markers, balloons and arrows to express your idea
- Allows you to take instant chart snapshots
- Provides you real-time conversation features
- Provides you real-time news and headlines
- Compatible with all web browsers on Windows, Mac, iPad, Android, BlackBerry, etc.
How To Generate Real Time Stock Charts?
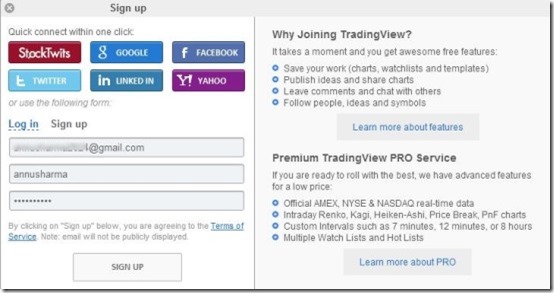
TradingView is a web app that can be accessed by the link provided at the end of this article. Once you are on the website, you can create a free account via Google, Facebook, Twitter, etc., or directly by providing your email address.
I chose to sign-up with my Gmail account and as soon as I signed up, it sent an activation key to me. Clicking on that directs you to Trading View website. Now you can view the stock chart of any company that you are interested in. Free Stock Charts provides you real-time stock charting based on HTML5 and cloud computing.
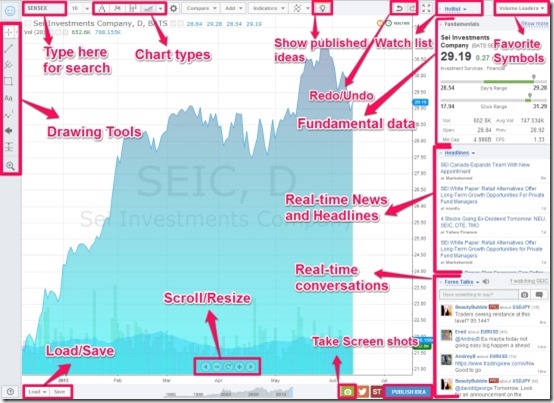
It provides you various info features and other options to change the layout of stock chart like:
- Indicators: Helps to prove your point of analysis when you publish or share your charts.
- Compare: Lets you compare any stock to any index or any other stockschanges.
- Fundamental data: Gives you necessary insight about the company.
- Watch list:List your favorite symbols and and links to the chart when you click on the symbol.
- Hot lists: Shows different symbols based on selected criteria.
- Publish: To publish ideas so as to get recognized in the trading community.
- Chart types: It gives you a variety of chart formats that comprises of time-based charts, price-based charts and other various kinds of exotic chart types.

- Real-time news and headlines: Let you see the relevant news related to the stock and lets you view the latest headlines form the leading news agencies.
- Real-time conversations: It enables you to chat and discuss the current market situations and enables you to send the screenshot captured from the main window.
- Take screenshots: It lets you to simply click on it so that it takes your screenshot and share the same at the same time. It provides screen capture facility in one click.
- Scroll/ Resize: Lets you to scroll the chart in backward or forward directions and enables you to resize the free stock charts at the same time.
- Load/ Save: Helps you to save your work and load your charts if you desire.
- Drawing tools: Provides you a variety of tools that let you mark your interesting points, trends or other predictions related to the market.

- Free Stock Charts provides you the heavy calculations in a simpler way with the help of cloud computing technology and provides you financial analysis in simple graphics.
You may also like Stock And Futures, Stock Analysis and Quick Stock Research Toolbar reviewed by us.
My Verdict For Free Stock Charts:
Free Stock Charts simply serves to be one of the best free stock charts tools as it provides you all the probable features in this app app that you get connected to the real-time environment 24×7.
As Free Stock Charts provides you personal online charts which can be easily embedded to any web source, it serves to be one of the best app to view free stock charts of the market. It provides you some PRO and PRO RealTime features which are paid. If you wish you can use them as well to upgrade your trading experience.


