This post lists some best free server hardware monitoring tools. Here I have added some really powerful tools that you can use to monitor live hardware status of your servers. I have added some tools which are online and need an agent to be installed on your server. I have also added some hardware monitoring dashboards in this post that you can set up on your server and then just forget them. You just need to obtain a simple URL to see status of the hardware on your server. Some tools in the below list are very powerful as you can audit the software inventory and perform remote management like tasks.
If you have some servers on VPS like DigitalOcean and want to monitor their hardware status then tools I have mentioned here will help you. You just have to execute a few commands on the server in order to make these tools send hardware report and you can analyze them easily. Some tools which I have added here create a beautiful graph of different aspects of the system hardware to make it more interactive. The graph and data these tools show is live as these tools automatically refresh the data after specified interval regularly.
4 Free Server Hardware Monitoring Tools:
Pulseway
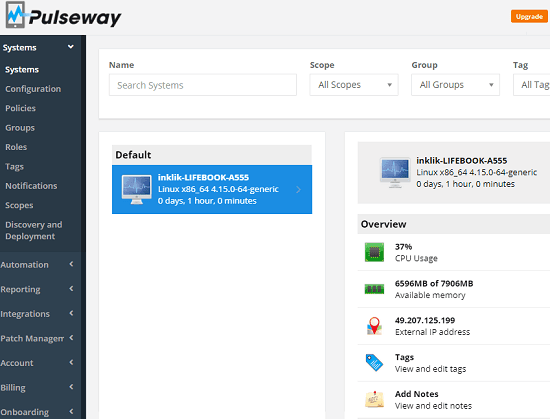
Pulseway is basically a remote management tool that you can use to monitor server hardware. Here you only have to create a free account and then get the agent that it gives to install on your server. After that, you will simply start receiving the hardware status on the online control panel. The setting up process of the client is quite long here and then you will have to sign in using your credentials in the agent. Hardware monitoring is just one part of this tool as there is option for remote management such as remote command execution, remote shutdown, remote restart, etc.
In the free plan of Pulseway, you can add 2 servers or desktop PCs for remote management. Apart from server, you can use it to manage your client PCs by installing software, patch management, etc. Same thing can be done in the server monitoring with ease. So, you sign up for a free account and note down your username and password as we will need that during registering the agent.
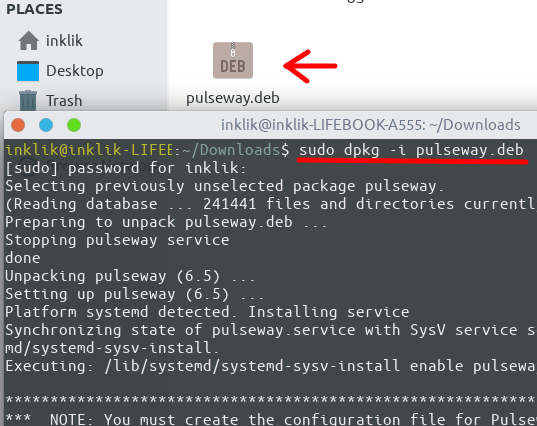
After you have downloaded the agent on your server, it’s time to install it. For Linux server, the agent will be a DEB file that you can install by running the following command. After the command finishes, you need to start the service as well by running the “systemctl” command that I have mentioned.
sudo dpkg -i PathToDEBFlile
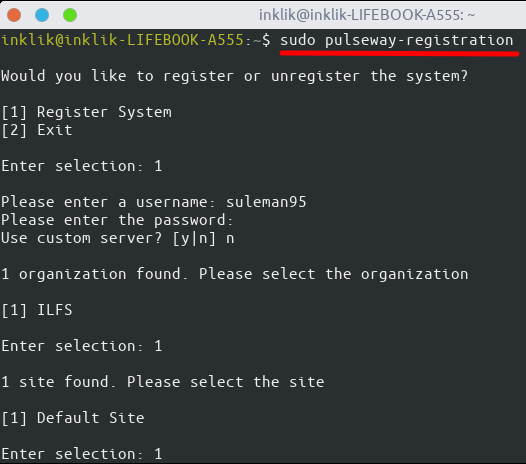
Now, let’s just start with the registration process. You just run the following command in the terminal and then proceed with the setting up process. Setup current server by choosing different option that it gives. And here it will ask you to enter the username and password that you used for creating the account. After successful authentication, it will setup the agent and agent will start sending the data.
pulseway-registration
When everything is fine, you will start seeing the server stats on the Pulseway dashboard. You can see the screenshot I have added in the beginning to see how this works. You can see the hardware details such as network status, disk usage, RAM usage, and CPU usage easily and do whatever you want.
Linux Dash
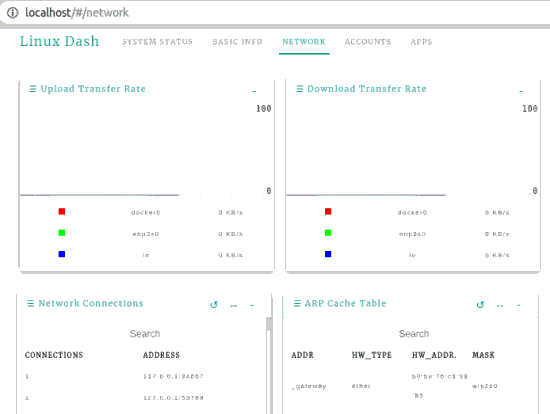
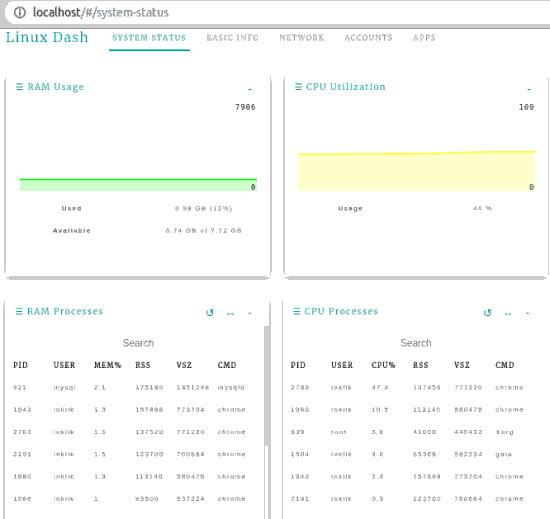
Linux Dash is open source dashboard that you install on your server to monitor hardware stats. You can quickly get started with this it now and then simply see the hardware stats of the server in details. It can show you hardware stats such as CPU utilization, RAM usage, upload/download rate, ARP cache table, RAM processes, network connections, basic information about the server, and some more details. It shows you the hardware stats in interactive way and you will like the final dashboard.
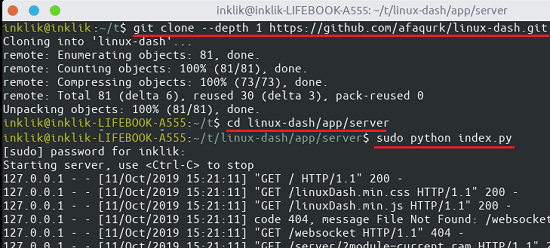
Getting started with this is very simple. You just open up a terminal and then clone the GitHub repository. This is a very nice app and can run using Python, Go, and Node.js. So, based on what you have installed on your server, you can use that. In my case, I will be using Python for this dashboard to run. To run this app, simply run the following commands one after another.
git clone --depth 1 https://github.com/afaqurk/linux-dash.git

cd linux-dash/app/server

sudo python index.py
After you run the above commands, the server will start on the port 80 by default. You just access the server and then simply see the main interface of the Linux Dash where you can see some very nice details about the hardware status of the server. There are various sections on the main UI of the dashboard in which you can see the different stats of the server hardware. You can just run this app once and then let it running in the background to show you the server hardware stats. Generate a URL and then you can always use that to instantly see the current hardware stats.
Note: Currently, this dashboard doesn’t show you the hardware details by default as there is a small problem in the code. You can refer to this issue to see how to fix it. I don’t know why the changes haven’t been pushed to the main branch, so you will have to do it manually. Just replace the code in the “app/server/linux_json_api.sh” file with the code mentioned in the issue and refresh the page after that.
System-Dashboard
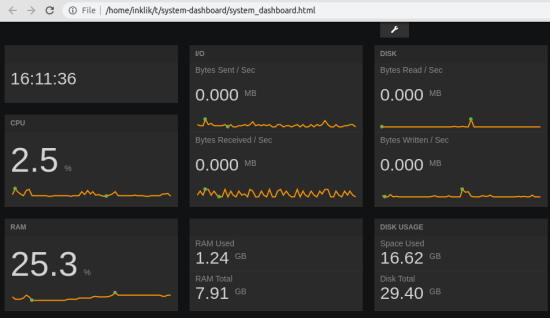
System-Dashboard as the name suggests is dashboard for your server to show you live status of server hardware. This is a simple Python app you can get up and running after executing a few simple commands. On the final dashboard, you can see the CPU usage, bytes received, bytes sent, disk read and write speed, current time, etc. You can see the screenshot above to see how the final server dashboard looks. You just install the app and then generate the URL to the dashboard and use it whenever you want to.
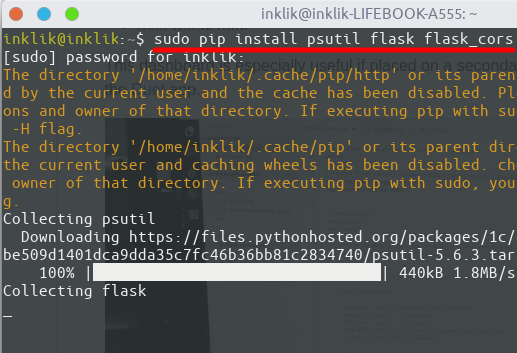
As I mentioned earlier that you need Python to run this app, so just let’s just get started. Python is usually available on Linux servers and in case you don’t have it then you can install it using the correct package manager. Open up a terminal of your server and then run the following command to install the dependencies.
pip install psutil flask flask_cors
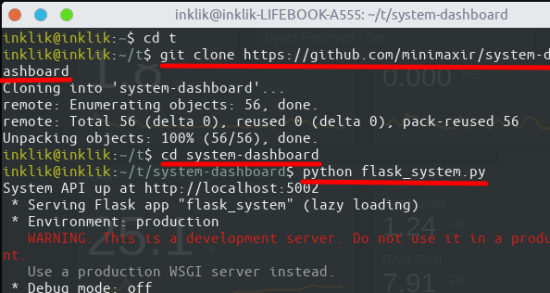
Now, clone this GitHub repository in some folder of your choice and cd into it. In the end, you run the main command to start the server and then access the main dashboard. Just run the following commands one after another to get the server up and running.
git clone https://github.com/minimaxir/system-dashboard

cd system-dashboard

python flask_system.py
When the server is started in the terminal, you can simply open the “system_dashboard.html” file in the browser in and choose “Load Freeboard” and select “system_dashboard_flask.json” in order to see the final dashboard. The final dashboard looks like as shown in the first screenshot in the context of this tool.
eZ Server Monitor `Web
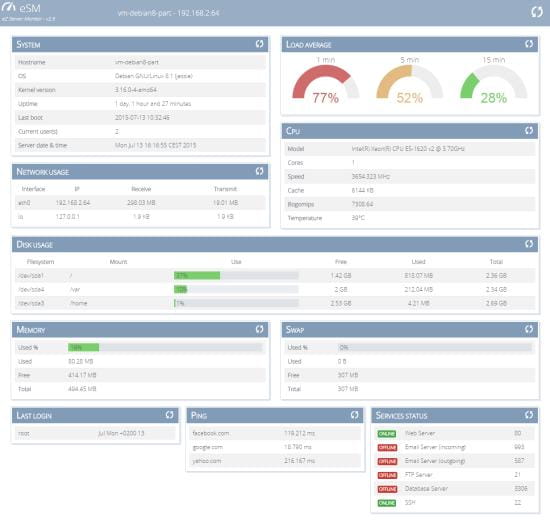
eZ Server Monitor `Web is the last free server hardware monitor that you can use. Just like above two tools, it is also a dashboard to see hardware status of your server. This is a PHP app and customizable one that requires no additional dependencies to be setup. You just put in the web server directory of the Apache or Nginx and access the main dashboard. It is simple as that and there is a config file with it which you can use to tweak a few parameters.
In this server hardware monitor, you can see RAM usage, disk usage, network usage, free space, pings, service status, swap, system details, and load average. Here you can see all this details from a simple and elegant dashboard. However, in my case it wasn’t showing system details and RAM stats I think due to some mismatch type or I don’t know. But it was able to show other stats correctly.
In my case, I was using XAMPP as the web server to run this dashboard. If you have the same then you can simply download it and then use that. Or, if you are familiar with the Nginx configuration then you are also good to go. You just download the repository from the above and then put the files in the server “htdocs” folder. Next, start the server and point that to the repository folder and then dashboard will show up. You will see various stats there that you can analyze. Not only this, but in the config folder, you can tweak the configuration file to change the themes color of the dashboard, disable some module, and change the refresh intervals.
Closing thoughts
These are the best free server hardware monitor tools that you can use for free. A little technical knowledge is required in order to set up these tools on your server. Just execute a few commands and simply get your monitor up and running. The hardware monitor dashboard tools I have added in the post work perfectly and you can use them on permanent monitor to quickly see overview of the server hardware. In case, you see anything unusual in the server hardware activity then you can quickly take further steps to resolve it. The only thing that I found missing in these server monitoring tools is the email alerts or alerts of any kind. Most of these tools are open source and I will suggest their developers to consider the option of getting alerts.