FCS stands for Flow Cytometry Standard. It is data file standard used to read and write data from flow cytometry experiments. Flow Cytometry is a laser or impedance-based biophysical technology used for cellular level experiments in biotechnology. You can read more about it here.
A single FCS file can contain multiple data sets produced by a cytometer. Those data sets contain various types of information regarding the experiment that produced the FCS file. FCS file format has four segments, Header segment, Text segment, Data segment, and Analysis segment. You can read more about these segments and FCS data structure here.
Also read: 6 Best Free Human Anatomy Software For Windows 10
How To Open, Analyze FCS Files In Windows?
FlowPy is a free software to open and analyze FCS files in Windows. It’s an open-end software, it lets you perform any possible statistical analysis on the FCS data. With this software, you can plot Histogram, Dot plot, and Cumulative Distribution for the selected dataset(s). You can use FlowPy for Data extraction, Data visualization, Data Clustering and Histogram Subtraction. To open an FCS file in FlowPy, simply go to Files -> Open FCS File and load your FCS file.
Analyze FCS Data:
With FlowPy, you can analyze the flow cytometry data (or FCS file data) in your own desired way. There is no pre-defined set of statistical analysis, you have the complete freedom to analyze every single data parameter as you like.
With FlowPy, you can do the following:
Extract Whole Data Set
There is no simple way to open and analyze FCS file, especially on portable devices. With FlowPy, you can extract the whole FCS data and export it to a simple text file. The extracted data is well formatted with parameter values for each cell. Once, you have all datasets in a text file, you can easily open it in any text editor or spreadsheet software for further analysis. This way, you can easily access your flow cytometry data on the go.
Extraction of partial data
You can also extract selected parameters with FolwPy. You can plot various visualization of parameters and save the visualization images along with the data. With FlowPy, you can extract and analyze data parameters of FCS file in the following ways:
Histogram:
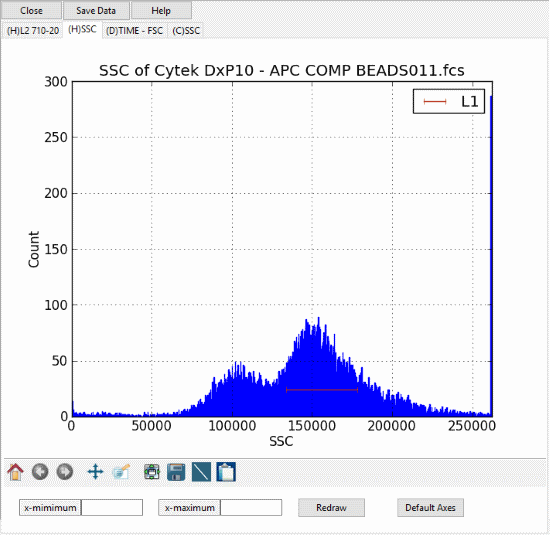
With FolwPy, you can plot a histogram of any data parameter from FCS data. Simply go to Plot -> Histogram and select the desired parameter to draw the histogram. You can save the histogram as an image file. Apart from that, you can select a specific region on the histogram and extract all the parameters data present in that region only. Then, you can create a Gate Statics table for this data.
FlowPy also lets you configure subplots parameters for the histogram. You can also adjust the x-axis values to deep analyze a segment of the selected parameters.
Dot plot:
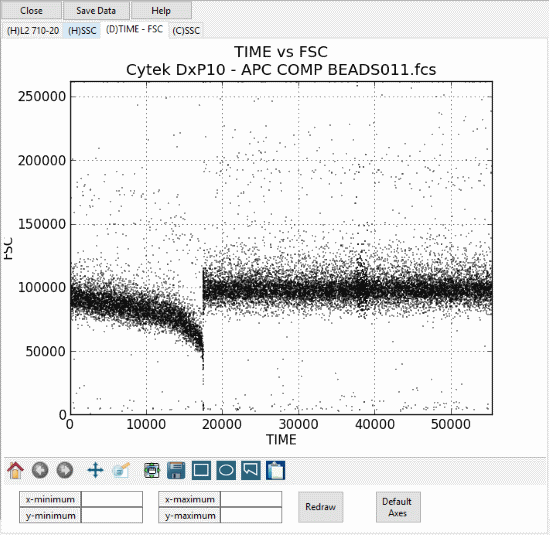
Similar to Histogram, you can also draw Dot Plot for any two data parameters. You can select a specific region of the plot and extract parameters from that region only. You can deep analyze dot plot by setting specific minimum and maximum values for both data parameters.
Cumulative Distribution:
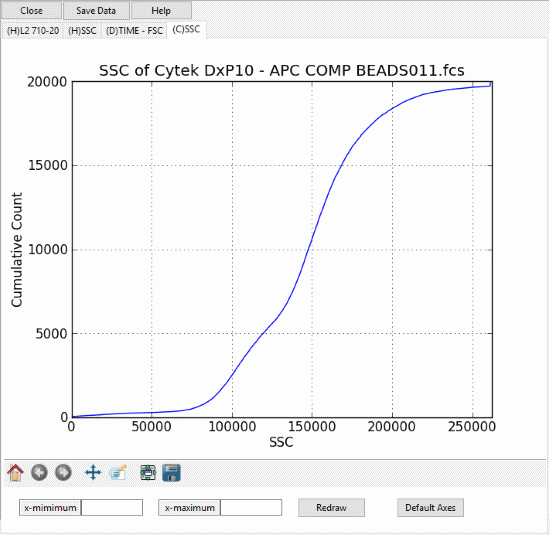
You can also draw a cumulative distribution graph of any data parameters. Again, you can set the minimum and maximum values to deep analyze a specific section and save the graph as an image.
Clustering:
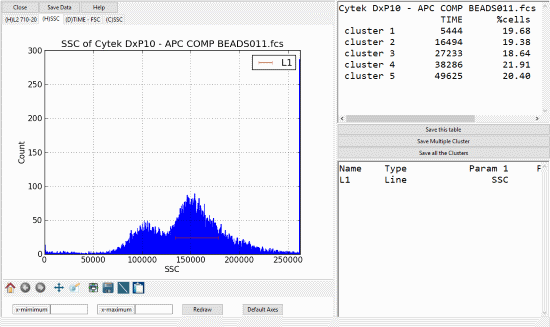
With FlowPy, you can also cluster the whole FCS dataset in any specific number of clusters.
You can choose more than two parameters and then cluster the whole data set in a specified number of clusters. Afterward, you can extract the parameter data from any of those clusters, and export the table of clusters as a text file. Currently, you can perform clustering with following four types of initiation options:
- Static Initialization
- Binary Splitting
- Random Initialization-1
- Random Initialization-2
Data Analysis:
Histogram Subtraction
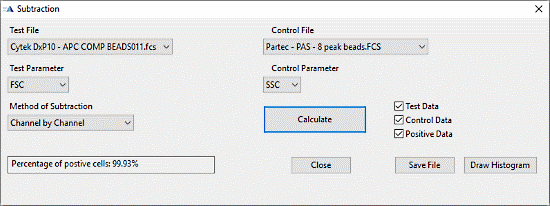
With Histogram Subtraction, you can compare two data parameter to identify sub-populations within a population. You can select a Test FCS file and a Control FCS file along with a test parameter and a control parameter. Then, you can select the method of subtraction and calculate the Positive Data, along with Test Data and Control Data. You can save the results as a text file and can also draw a histogram.
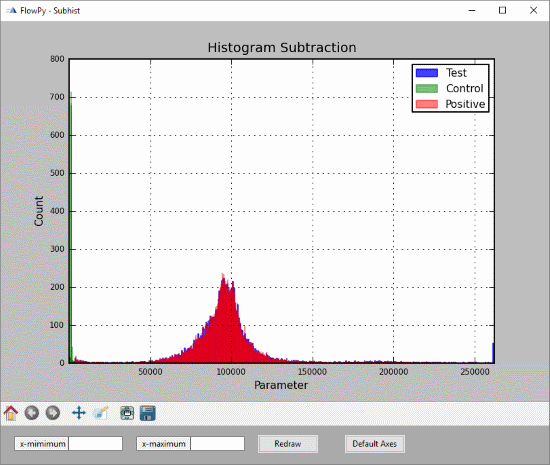
The histogram of Histogram Subtraction shows you the Positive Data along with Test Data and Control Data. You can deep analyze the histogram data for a specific parameter range and save the histogram as an image.
Statics
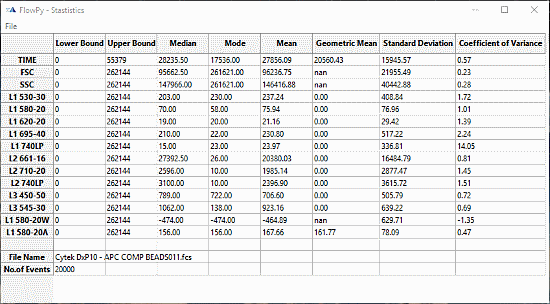
You can create a static table for all data parameters present in your FCS file. You can create a Total Statics table and a Gate Statics table. A Total Statics table contains Lower Bound, Upper Bound, Median, Mode, Mean, Geometric Mean, Standard Deviation, Coefficient of Variance for each parameter along with the total number of events. Whereas, a Gate Statics table contains statistics about specific data parameters from a specific selected region in histogram and dot plot.
You can download this FCS Reader and Analyzer software from here.
Closing Words:
FlowPy is the best free software to open and deep analyze FCS file on Windows. It lets you extract specific datasets from the FCS file and help you visualize them. You can open extracted data in a simple text editor which makes it way easier to access as compared to FCS file.