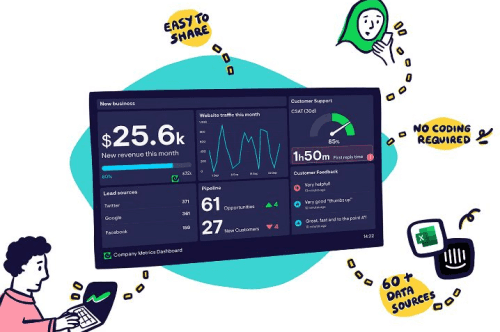
Geckoboard is a free online weather where you can create interactive dashboards from a variety of services including a spreadsheet. It lets you create a dashboard from Excel and Google sheets and lots of other services. It lets you customize the data in any way you want. It supports a lot of data sources but in the free plan you are only allowed to create dashboard from Excel and Google sheets. You can present any data graphically by fetching it directly from a spreadsheet that you have and it even gives you link that you can use to share your dashboard anywhere you want.
There are many online dashboard creators out there but this one here is really professional looking. It even offers some more customization features than those. However, you are limited to one dashboard only in the free plan. Also, you can only use Excel and Google Sheets as data source but I think it is good for individual use. And all you have to do here is connect your Google Drive in case you want to use a Google sheet or load an Excel file. Apart from these, it supports platforms like Google Ads, Instagram Business, HubSpot, Jira, GitHub, etc.
How to create free Shareable Dashboard from Excel, Google Sheets?
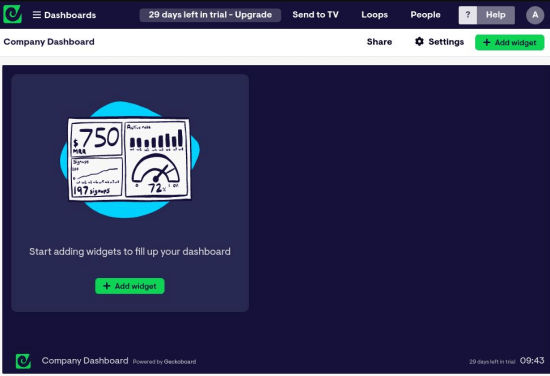
Getting started with Geckoboard is very simple as you just have to sign up for a free account. After you are on the main interface, you are given a blank dashboard. And you just click on the add widget button to start adding your first data source.
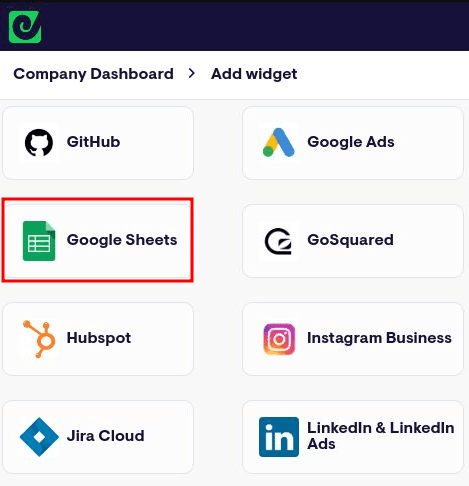
Next, you select the data source. In the free plan I already mentioned that you can only select Google Sheets and Excel option. Other options are there as well but since the free account comes with 30 day free trial so those options will not be available after 30 days. So, you just select Excel any spreadsheet format.
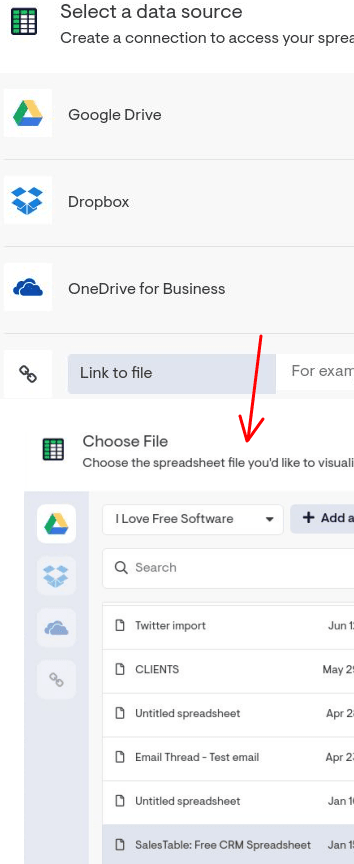
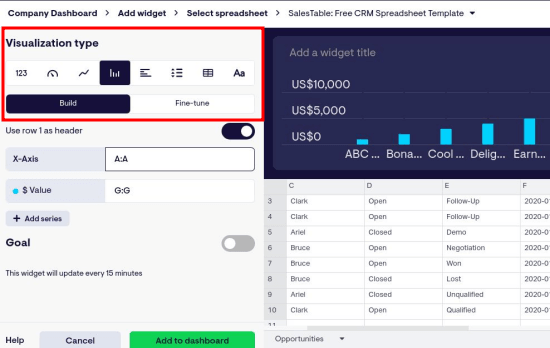
Move on and the next steps to configure the data source. So, basically after connecting a spreadsheet you have to specify how data should be visualized. To do that, you will be redirected to the customizable interface where you can select what data from the sheet you want to display. And how you can display data in graphical form using the various charts that it supports. For the widget, you have to specify the X and Y axes and then just see the preview of the final dashboard widget.
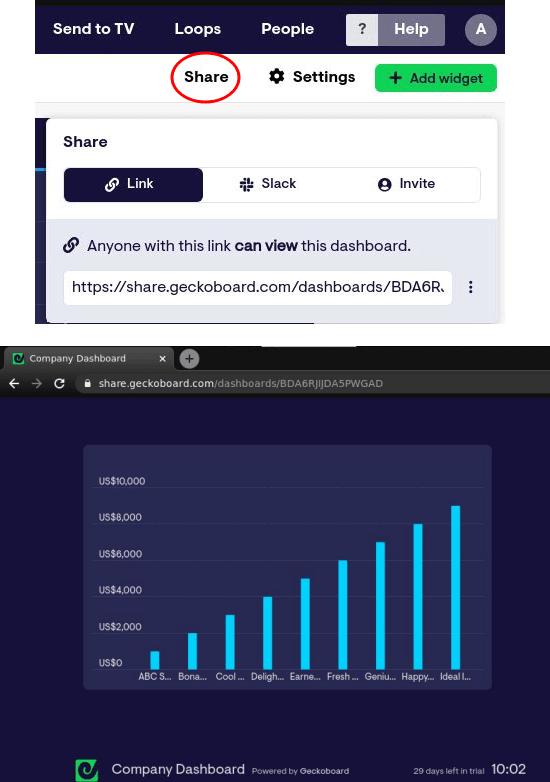
Finally, you can now return to the main interface and then generer shareable link to your dashboard. The generated link can be shared with anyone.
In this way, you can use this simple and powerful dashboard tool to visualize spreadsheet data. And not just one but you can add many widgets there. You are free to customize their visual representation in any way you like.
Closing thoughts:
If you are looking for a free dashboard that you can use to display some data from a spreadsheet report then you are in the right place. Geckoboard is a very good option for displaying data in a very clean and pretty way. You just have to connect a data source and then specify what type of data you want to display. And then get it done. I really liked its interface and the way it works to let you create a free dashboard. So, just give it a try and let me know what you think about it.