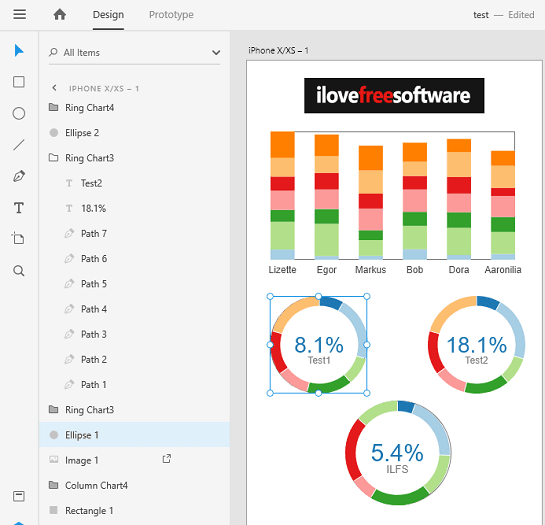
VizzyCharts lets you create charts in Adobe XD from CSV for free. Here it uses a CSV file for the real data that you want to use for the visualization and then generates the corresponding chart. It supports column, line, and ring charts and then you can easily add them in your mockups. All you have to do is select the shape in which you want to add the chart and then specify the source CSV file that you want to use for the data. It is simple as that. There is nothing like sign up or anything you have to do. Just install the plug-in and start creating charts in Adobe XD.
If the mockup you are creating requires some charts to be added there then you can take help of this simple plugin here. You just have to feed a CSV file and customize the color of the chart if you want to, And then in one click, you can add chart in your design and then save changes. The chart it adds is resizable and draggable. You can easily change its position and size to make it fit in the design. Also, you can opt to add charts in the design using keyboard shortcuts.
How to Create Charts in Adobe XD from CSV using this free Plugin?
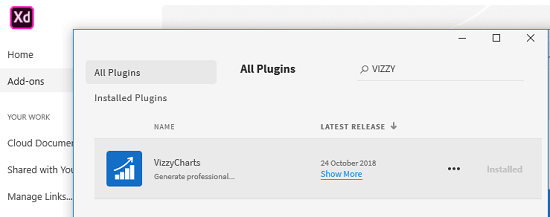
You can install this plugin right within in XD. You just go to the plugins section in XD and search for it in the Adobe store. It will show up there and you simply have to install it. After that, you are all ready to use this simple plugin.
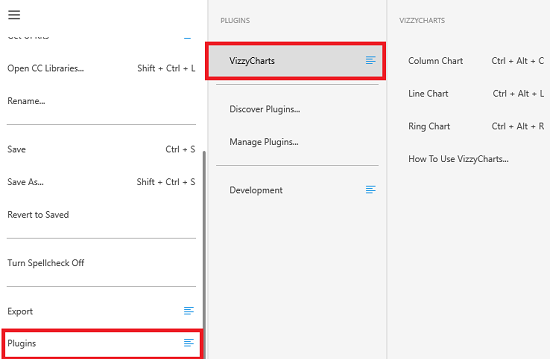
In your design, create a shape based on the type of the chart you want to add. Next, go to the menu of VizzyCharts and then you are free to choose any type of chart that you want to add. I have already mentioned that it lets you create three type of charts. You can even choose to make chart using random data that it gives you.
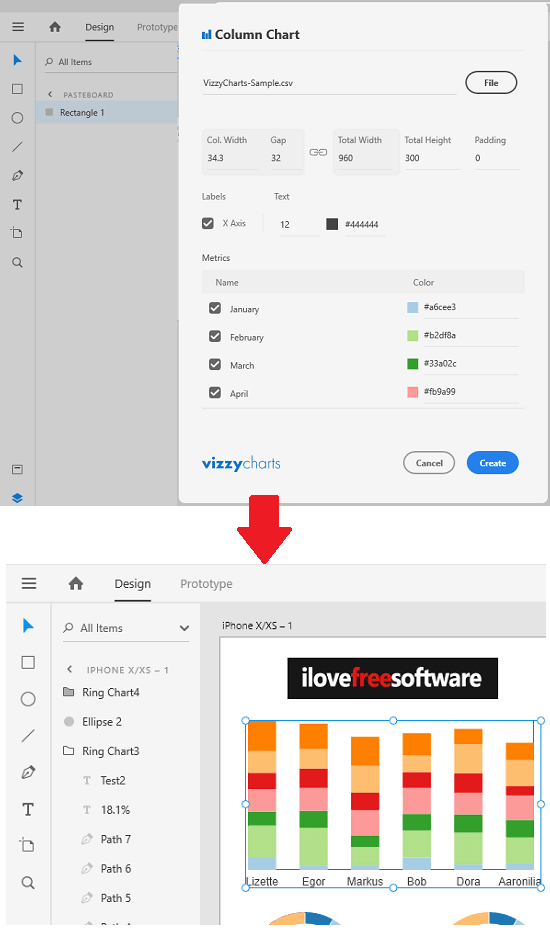
In the plugin options, specify the CSV file that you want to use for data visualization and then you can simply specify other options there. You can specify the colors for the charts and options such as column height, width, excluding some data from the chat, etc. After all this, simply hit “Create” button and it will immediately add the chart in the design. See the screenshot below.
That’s how you can use this simple XD plugin to create charts in XD from CSV and add them in your designs. You can use it to easily create distinct charts and then export them along with your designs. The advantage of using this plugin is that you can use real data which is good for demonstrating your work to the clients.
Closing thoughts
If you use Adobe XD for creating website and app mockups then you will like this simple and useful XD plugin to create charts. The plugin is clean and a few clicks are all you need to add a chart in your design quickly. However, the only downside that I see is limited number of chart types. Charts type such as pie chart, etc., are missing but if you are okay the types that it offers now then you are free to give it a try.