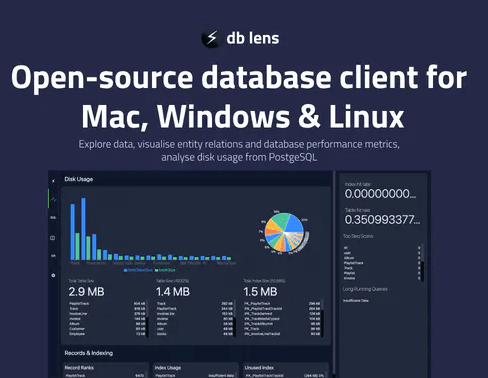
DBLens is a free and open-source PostgreSQL client with database performance metrics and disk usage. Here this is a powerful PostgreSQL editor that you can use to quickly connect to a database, run SQL, browse through database tables, and see the database system perforce on a dashboard. It lets you connect to multiple databases as well, both local and remote ones.
We have covered PostgreSQL editors before, but this one here is a nice one to have, especially if you also want to keep an eye on how well your database is performing. Apart from feeding and retrieving data from the database, you can see the index and table hit rate. You can see the size of the tables on the disk and statistics about the longest running queries.
There are some other details that it shows you graphically for you to analyze. If you have a large PostgreSQL database that you use frequently, then the database metrics that it shows will help you tune or optimize it. For now, you can use DBLens on Window and macOS, but I hope there will be a release in the future for Linux systems as well.
Free PostgreSQL Client with Database Performance Metrics, Disk Usage: DBLens
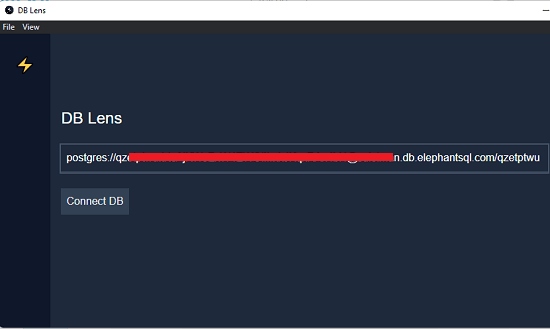
You use DBLens in the same way as any other PostgreSQL database client. Download it for Windows and MAC from here and then simply open it. To connect to a database, it only needs a database connection string. So, just specify a connection string and then connect to the database.
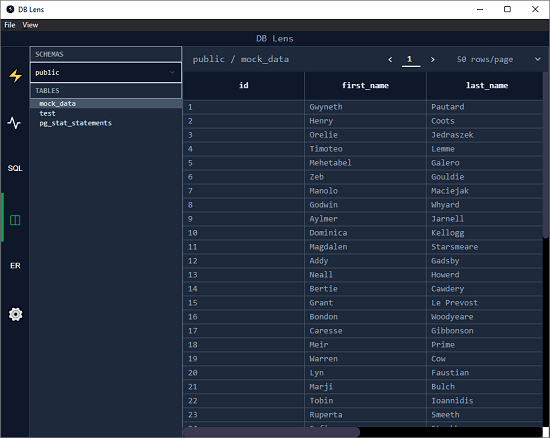
After connection, you can start browsing the database tables and even run SQL queries. Go to the Table section from the left sidebar, and there you will see the available data tables and schema. Just select a schema and a corresponding table. It will show you the data instantly and you can browse all the rows and columns. However, you will not be able to edit them or export them.
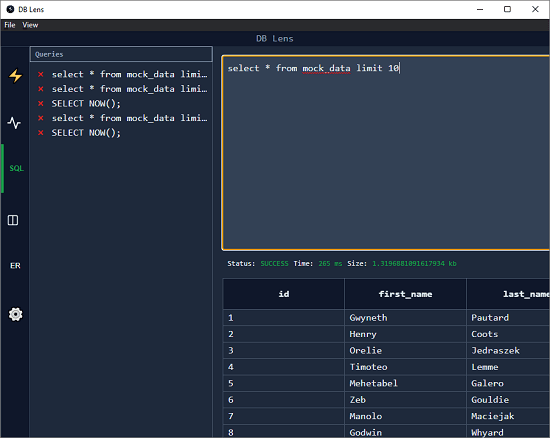
Next, you move to the SQL section. Here, you can run simple as well as complex SQL queries and see their output. It will show you the data in the lower pane with execution time stats. All the SQL queries that you run here will be logged for later use. But you can delete from the history if you want to.
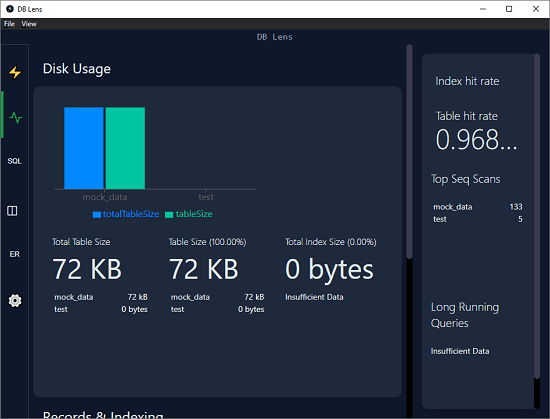
Finally, you can move to the dashboard where you can see the database system metrics. Here you can see all the details about the disk usage by the tables. Not only that, but here it also shows indexing stats and table and query hit rate. All these metric are available right there on the dashboard and you can analyze them to take decision to tune your database.
In this way, you can use this simple and powerful PostgreSQL client on Windows. The process is same for macOS and in the future updates there will be more features.
Final thoughts:
If you are in need of a PostgreSQL client, then you are at the right place. Just try DBLens and it will help you uncover the database system metrics with disk usage that other clients of its kind often miss. Right now it is in active development and there may be more features in the coming updates.