UpDown Meter is a free software for Windows to show real-time network activity graph of a specific network adapter. It is a minimalistic software that displays download rate and upload rate of a network adapter in your PC. You can also use it to view a real-time network activity graph in Windows System Tray. It is quite easy to configure; you just have to select a network adapter and specify its actual speed (in bytes per second). It will then start displaying download rate and upload rate using graphs, as shown in the screenshot below.
UpDown Meter is quite a simple network monitoring software. If you are looking for an advanced one, then you can check out Glasswire which is a free network monitoring and security software. You can also check out RAS Graph & Stats which can help you in keeping track of dial-up, modem, and ADSL connections, but what separates it out from these software is that you can use it to quickly see real-time network activity graph of a specific network graph.
How to see real-time network activity graph of a specific network adapter:
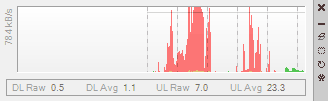
As I already mentioned above, you can use UpDown meter to view network activity graph of any selected network adapter on your PC. In its graph, it displays the current download rate and upload rate of the network adapter. Download speed is displayed in red color and uploaded speed is displayed in Green. The graph flows from right to left, that means the latest information is displayed on the right-most side of the graph. You can also keep it minimized in the System Tray of your PC and get to know the current download and upload speed of the selected network adapter by hovering your mouse on its System Tray icon. It also gives you the option to keep it always on the top of any window and make its interface translucent.
Let’s now see how you can see a network activity graph of a network adapter using UpDown Meter:
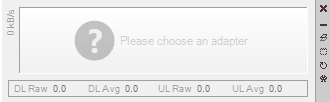
Step 1: Download it from the link provided at the end of this article and extract the downloaded ZIP file anywhere on your PC. After that, run its application file and its main interface will then appear displaying a message to select a network adapter, as shown in the screenshot below.
Step 2: To select a network adapter, click on its settings icon; it will then pop up a window from where you can select a network adapter. Another important step that you have to do it is that you have to calibrate it by specifying its actual speed. You can test the actual speed on Speedtest.net and then specify it in Actual Speed field in bytes per second. 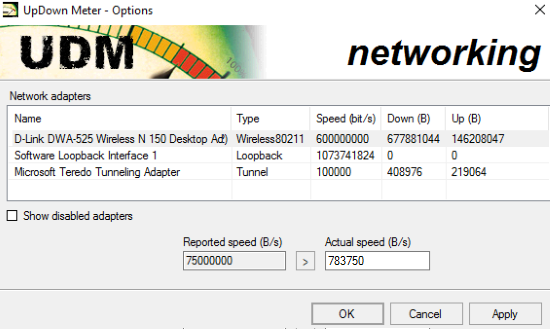
After that simply, click on Apply or OK button to see network activity graph of that adapter.
How to view real-time network activity graph of a specific network graph on System Tray:
One of the unique features of UpDown Meter is that it displays a real-time network activity graph of the specific network graph in Windows System tray, as you can see in the GIF added below. You can also see the current download rate and upload rate by hovering your mouse over its System tray icon. To view real-time network activity graph of a specific network adapter on System Tray, simply minimize UpDown Meter. It will then take up a little space in your System Tray displaying a real-time network activity graph.
Verdict:
UpDown Meter is a free software for Windows to show network activity of a specific adapter using graphs. I will recommend it as it is a lightweight (just 50 KB) and simple software to monitor network activity of a specific network adapter, and it is available for free.
Download UpDown Meter from here.