This article covers a free online chart maker tool where you can visualize data on charts and download as PNG files. Charts are a neat way to visualize complex data easily. By plotting a chart of the data, you can easily analyze the data to notice trends, growth, etc. There are many online chart maker tools that you use to quickly plot a chart instead of messing through spreadsheets in MS Excel or Google Sheets.
Chart It is a free online chart maker tool where you can visualize various types of data on different types of charts including candlestick, geo, heatmap, stepped area, combo, etc. This tool doesn’t need an account, you can just visit the website and start making charts. You can add multiple datasets and then create charts to visualize the data. After creating a chart, you can download it as a PNG file. You can also save the chart to get a public link along with HTML snipped to embed it on webpages.
Also read: Gantt Chart for Trello Free: Visualize All Boards in Gantt Chart
Free Online Chart Maker to Visualize Data, Download as PNG
Chart It allows you to quickly visualize any type of data into charts. The process is straightforward, all you have to do is visit the website and create a new chart. Then, you can add your data and pick the parameters that you want to plot on the chart. You can explore some templates on the website to get a more clear idea about the tool.
Add Data
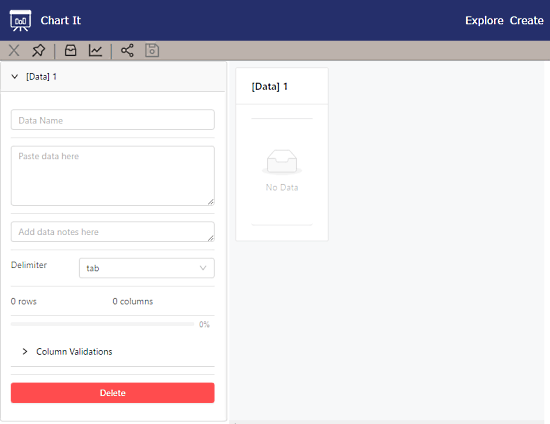
When you create a new chart, you get a menubar at the top. The menubar has a Data and a Chart option on positions 3 and 4 respectively. With these options, you can add a respective tab to add data and charts. You can add multiple tabs to use multiple datasets or create multiple charts.
In the data tab, you can paste your data, add a name for it and pick a delimiter. After adding the data, you can perform column validation by picking data type for columns from number, string, and date.
Create Charts
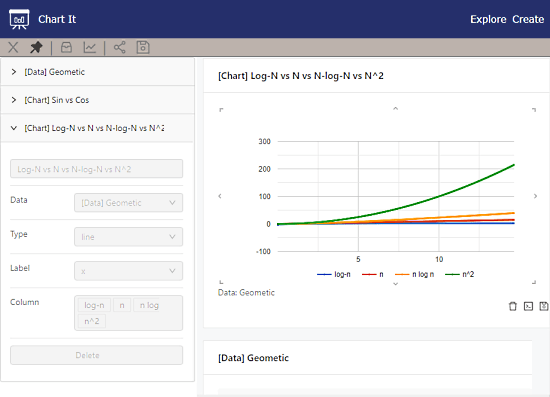
Once the data is ready with column validation, you can add a chart from the menubar to plot the data. In the chart tab, you can name it, pick data, chart type, label, and column. As you pick these options, a respective type of chart is generated for the data.
Download & Get HTML Embed Code
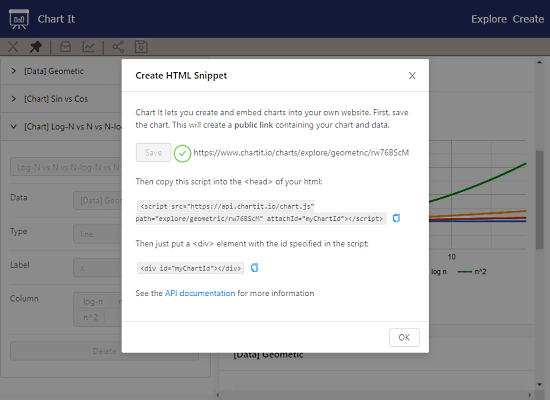
At the bottom right corner of the chart, you get options to delete, download, and embed the chart. The download option (save-icon) lets you download the chart as a PNG file. The embed option saves your chart online and creates a public link to it along with HTML embed code. You can use the link to share the chart and HTML code to embed it on webpages.
Closing Words
Chart It is a decent online chart maker tool that is simple to use yet packs useful features. It allows you to quickly plot different types of the chart to visualize data. Unlike spreadsheet or many other online charting tools, it doesn’t require an account which makes it handy and quick. The developer of this tool is building an API for it. So if you need an API for making charts quickly, that feature is coming soon to Chart It.