graph-cli is a free command line tool to create graphs from CSV data. Here it lets you create as a PNG image by taking different X and Y values from a CSV file. Using this simple tool, you can create sine, cosine, sine-cosine, bar, and linear graph easily. You just have to supply a CSV file and some other optional parameters. The graph image that it creates is of high resolutions. And you can use that image in your documents, websites or at any other place. It supports some custom parameters that you can use to specify custom label and scale on X, Y axis.
There are some online grapher and some free graphing software that you can use to do the same. But using a command line tool to do stuff has its own advantages. You can use this tool as a backend to your applications or do anything else that you want. To create neat and a high-resolution graph image, you just have to execute a simple command. This tool is written in Python and that is all you will need to download, install, and use it.
How to Create Graph from CSV Data using this Command Line Tool?
graph-cli is an open source tool that you can run almost all platforms that support Python. And there are very simple commands to install and use it. You can easily use it to generate a graph image from a set of different X and Y values from a CSV file. The process to get started is explained below.
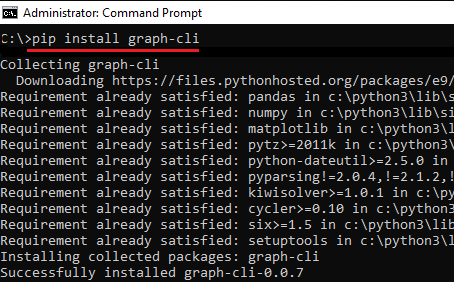
Step 1: To install graph-cli tool on your PC, simply run this command in admin mode.
pip install graph-cli
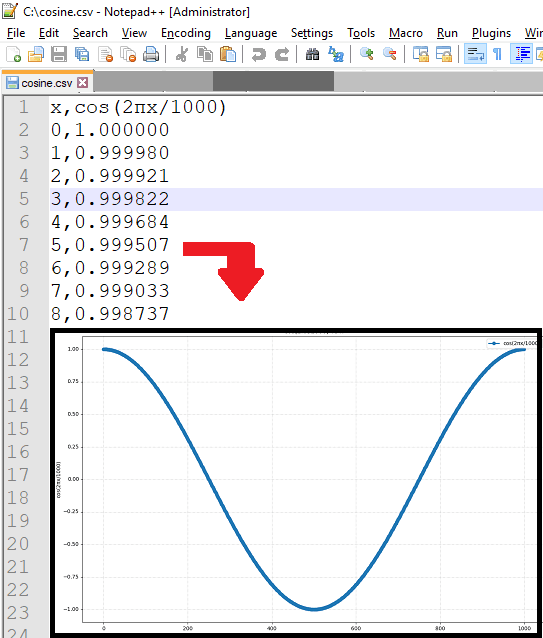
Step 2: Now, the tool is installed and its all ready to use. Below is an example to generate a sine graph using a “sine.csv” file. Also, you can generate the cosine graph, just change the values in the CSV file and run the command in the following syntax.
graph sine.csv -o sine.png

graph cosine.csv -o cos.png
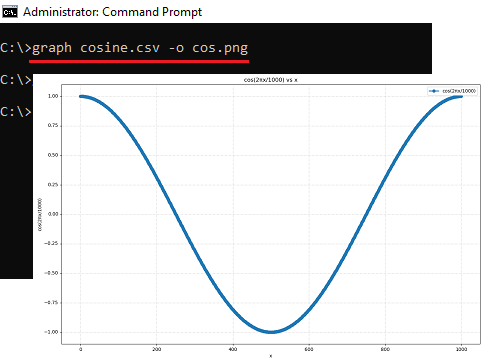
Above, you can see how this tool works to generate the graph by plotting values from CSV file. You can use it to create any graph that can be drawn using the X and Y coordinates. Just add the coordinates in the CSV file that you want to use and then simply execute a simple command to generate the image of the graph.
By default, it uses the column names in the CSV file as labels of the X-Y axis in the graph image. If you want to change the labels in the graph image then you will have to change the name of the data columns in CSV file. Or, you can supply names explicitly using some command line options. You can also change the scale in the graph and you can read more about custom parameters here.
Final words
graph-cli is really an amazing tool to generate graphs from a CSV file. The precision and accuracy in the plotted curve is fine and you can easily use it. It automatically analyzes the scale based on the values in CSV file but you can specify custom scale as well. So, if you want to try this unique graph generator tool, then this article will be helpful.