Reflect is a free and online MySQL, MSSQL, CSV, Postgre database visualization tool. It lets you connect to a variety of databases online and then lets you create views from the datasets. Apart from the aforementioned databases, you can also connect to Redshift and SQLite databases. After connecting to your database, you can create a view of statistical report which you have stored in the database. It allows you to visualize your data with the help of different types of graphs. You can create a bar graph, donut chart, time series, scatter graph, line graph, KPI, and area graph. You can create multiple views from the databases and render the report. It gives you an HTML snippet that you can use to create a page on your website and share it. However, in the free plan, only 1000 renders can be made per month.
Reflect is a very helpful tool for the marketers who frequently need to change their stats. And doing that manually will take a lot of time as in that case a developer will have to write code for that. But Reflect takes that pain away. You just have to create a view by choosing a suitable graph and corresponding values. After that, it will automatically generate the code you can upload to your website.
How to use this Online MySQL, MSSQL, CSV, Postgre Database Visualization Tool?
Reflect makes it easy to visualize your data from various databases without coding. You can use it anytime, generate a report, and update your customers, clients. Even if you don’t have knowledge of dealing with databases, then you will easily figure out how to generate a report using Reflect.
Here are some steps which will guide you to use Reflect. Before starting, please make sure that you create a free account on Reflect’s website using the URL at the end.
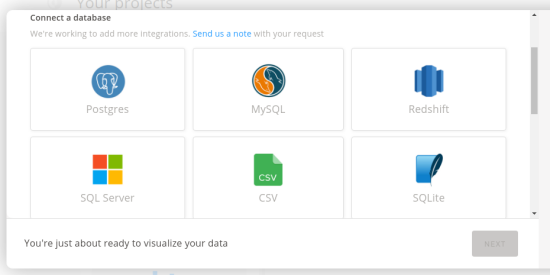
Step 1: After logging in to your account on Reflect, the first step is to connect to your database. From your dashboard, create a project and then give it a name. After that, connect to a database. It supports various varieties of databases, so depending on which one you have, connect to that using the credentials and connection URL.
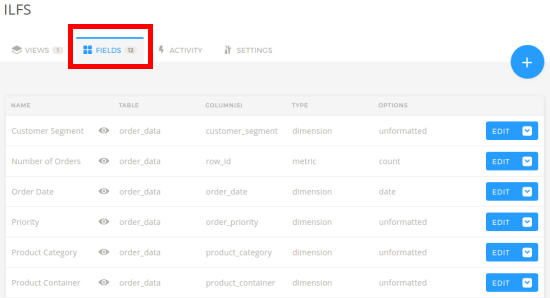
Step 2: When you have successfully connected to your database, then you can start creating the views. but before creating a view, you will have to select data sets from the database you just connected. The data sets are mainly the columns from the database tables and to define the columns, use the Feilds section of your project.
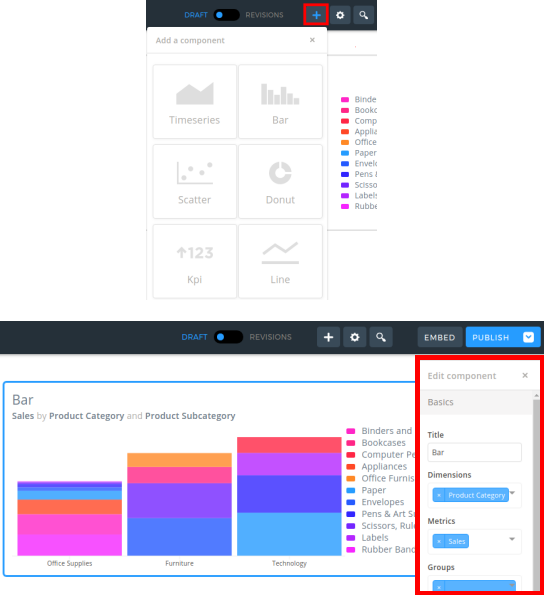
Step 3: Create a view by clicking on the plus (+) icon in your project. It will ask you to give a name to the view and then it will take you the view editor. There you can choose a component (graph) you want to use for your report by clicking on the plus button from the top. Next, you can define the dimensions and then metrics for the graph using the respective dropdowns.
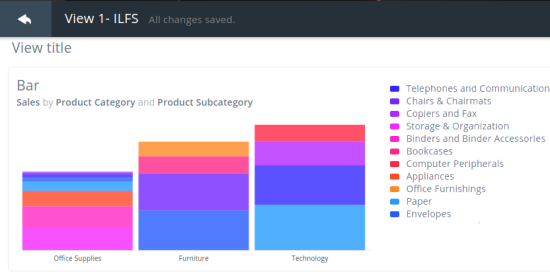
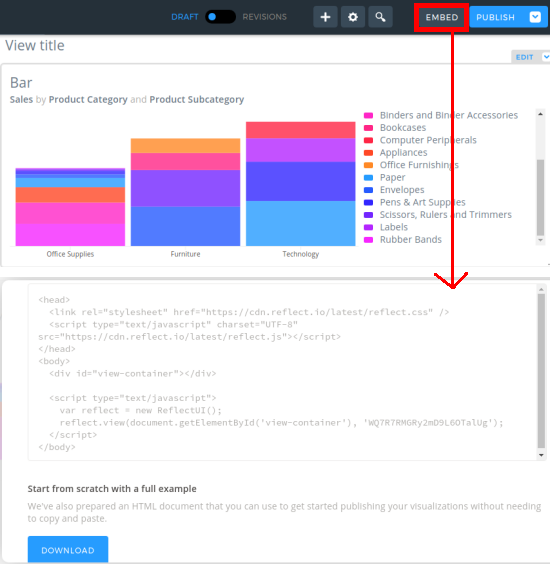
Step 4: After the view has created, you will see the graph’s preview on its interface. After that, you can save and publish your view. To get the HTML code snippet, simply click on Embed button from the top and copy the code, use it.
That’s how Reflect works and you can easily create a statistical report in a few minutes without writing code. It is very easy and won’t consume so much of your time. Apart from all this, Reflect also records your activities that you do. In the activities section in your project it logs what you have done, what queries you ran, what changes you made etc.
Closing Words:
Reflect is a very nice database visualization tool that I have ever used. And what I really like about this is that it lets you connect to multiple databases at the same time and lets you create multiple views. This is very helpful for the people who often need to show a statistical report to their customers, clients. So, if you are looking for an online database visualization tool, then Reflect is a very good option.