MagicPlot Student is a freeware for plotting and nonlinear curve fitting which is intended for scientists, students, engineers. MagicPlot Student is free of charge for noncommercial purposes including education. For commercial purposes you can use paid and full-featured MagicPlot Pro edition. Some features are supported in MagicPlot Pro only. This review will cover the features of freeware edition of MagicPlot.
MagicPlot works with Windows, Mac, as well as Unix. So, no matter which OS you are using, you can use MagicPlot for plotting data.
Here are some of the features of this Free Plotting Software:
- Publication-quality customizable X-Y plots with error bars
- Powerful text table import dialog with plot preview
- Visual multipeak, polinomial fitting
- Data manipulation (column formulas)
- Useful plot (scale) navigation with mouse, data picking
- Multi-level undo/redo with history
- Built-in formula calculator
- Available for Windows, Mac OS X and Linux
- Only 2 MB, does not need installation
How to Use MagicPlot for Plotting Data:
MagicPlot Student is a scientific data plotting software. Best way to review such a software is by taking some real data, and plot that on software. Instead of cooking up some dummy data ourselves, we decided to take help of MagicPlot team to provide us with some real data and use case. Alexander from MagicPlot helped us out with that, and provided all that we needed.
In case you want to follow along this example, download MagicPlot. As we mentioned above, it does not needs any installation.
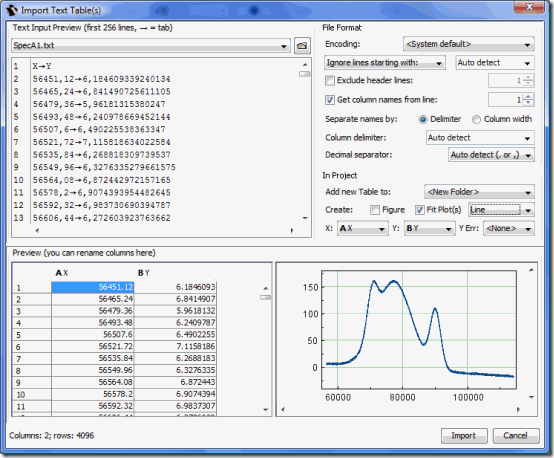
Now I have a text file with some noisy spectrum data. This file contains table with two columns: x, y. I want to make a graph of this spectrum and fit it with some Gaussians. I select Project->Import Text Table menu item and select my file in file browser. MagicPlot opens Import Options dialog.
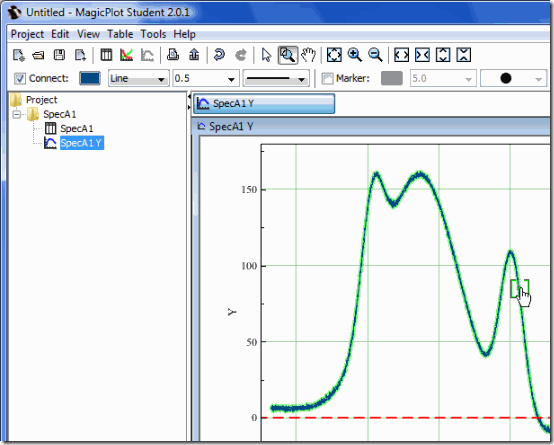
There are many options of file format. The main are encoding, column and decimal separators. I can check ‘Create Fit Plot’ just in this dialog and MagicPlot import my file and creates Fit Plot. Curves are clickable and selectable. The program shows basic format properties of selected curve in inspector toolbar.
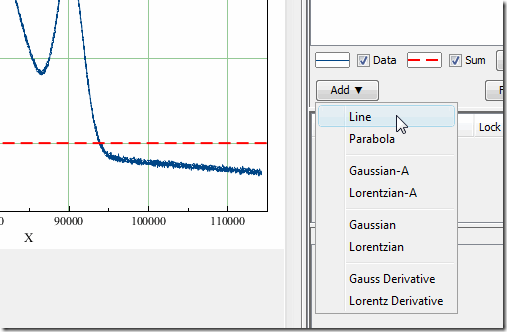
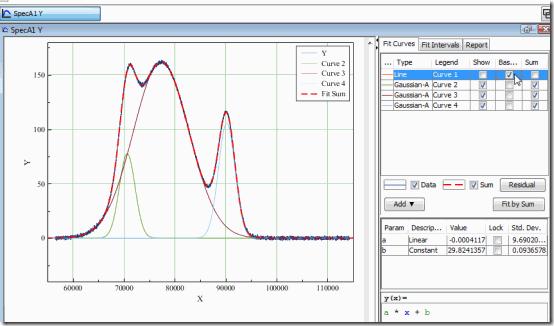
Now I want to fit my spectrum with sum of thee Gauss functions and linear baseline. First of all I click on ‘Add’ button to add ‘Line’ function to fit baseline.
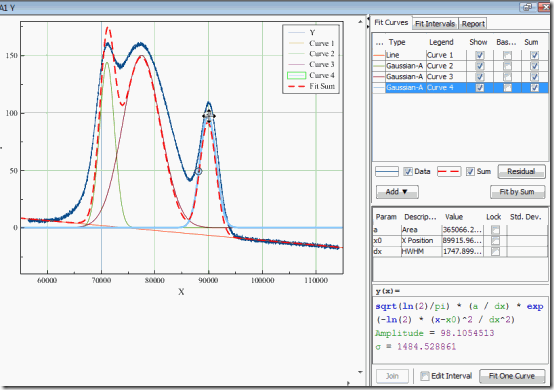
I can move this line on plot with mouse. Then I add 3 ‘Gaussian-A’ peaks and change it positions with mouse just on plot. Custom equations can be used in MagicPlot Pro edition only.
My fit model is set and I click ‘Fit with Sum’ button. MagicPlot uses least-squares method to fit the parameters of Gauss peaks and baseline. After fit the fit sum (red dashed line) lies right on my noisy spectrum. Now I check ‘Baseline’ checkbox for baseline and it is subtracted from experimental data. Now I know the fitted parameters of Gauss peaks.
MagicPlot creates beautiful graphs. ‘Fit Plot’ window may contain only one experimental curve. I can create ‘Figure’ to plot multiple experimental curves on one axes box.
MagicPlot provides multi-level undo/redo feature with history dialog.
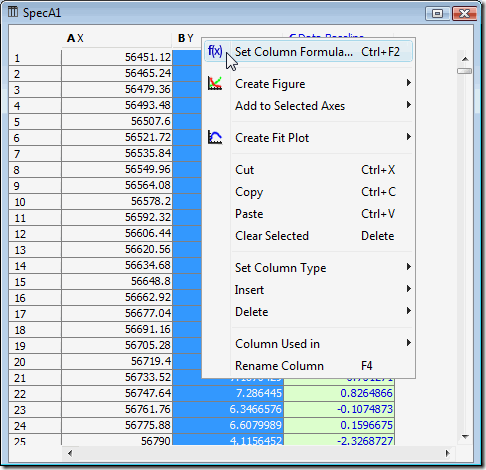
I also can edit the table with data and calculate some new values with formulas.
MagicPlot includes useful calculator dialog (Tools->Calculator). This is simple formula calculator which supports variables, we have already reviewed it as an standalone application.
So, if you are a Math or Science student, and need to plot data; do check out MagicPlot student. It is a full featured plotting software that works pretty well. All the options have been thoughtfully designed to help in plotting all types of nonlinear curves.
Download MagicPlot Free.
