Visible Speech involves capturing the features of speech or sound through a graphic or pictorial representation, typically achieved through a sound spectrogram. The spectrogram provides complete portrayal of an audio segment, visually illustrating time, frequency, and amplitude in a single graph. While conventional audio waveforms show variations in sound amplitude over time, spectrograms showcase shifts in signal frequencies across a duration. Furthermore, amplitude is represented as a third dimension through the use of distinct colors or variable brightness.
Spectrograms prove highly beneficial by revealing electrical or irregular noise in audio, enabling visual isolation of such disturbances. Additionally, they can be employed to phonetically identify spoken words, making them particularly valuable in post-production for their detailed insights.
This article talks about a speech and sound analysis tool known as Sonogram Visible Speech 5.0. The tool employs STFT (Short-term Fourier transform) and various algorithms to analyze speech and sound signals and is available for Windows, macOS and Linux. It utilizes spectrograms to visually depict the spectrum of frequencies in a sound or other signal, showcasing how they change over time or in response to specific variables.
Working:
1. Initially, it is essential to confirm that your computer has Java version 16 or a later version installed. If not, you can download it by clicking here.
2. Click on this link to download the Zip archive of Sonogram Visible Speech 5.0 from GitHub. Unzip the archive and run the Setup to install the application on your computer.
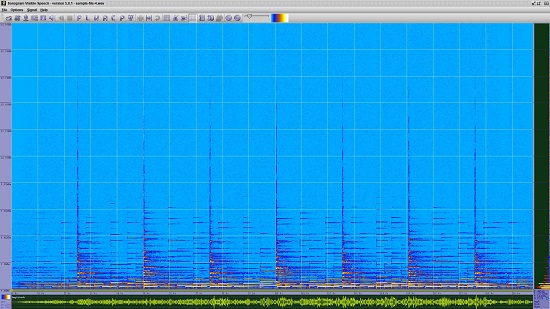
3. Launch the program, click on ‘File | Open Local media file’ and load any WAV audio file from your computer.
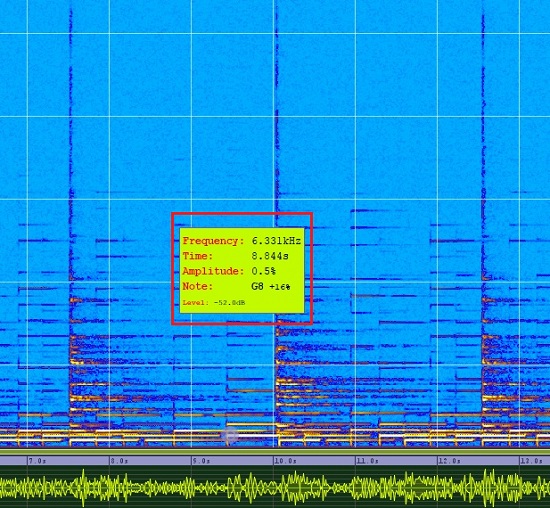
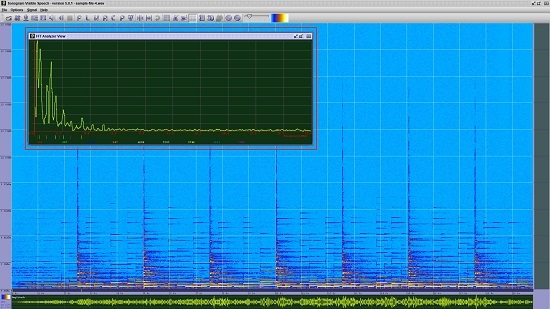
4. Just wait for a few seconds and you will be able to see the detailed audio spectrogram on the screen. Hover your mouse cursor over any part of the spectrogram and you will be able to see the Frequency, Time, Amplitude etc at that point.
5. You can Play, Rewind or Stop the audio from the ‘Signal’ menu or by using the shortcut keys Ctrl-P, Ctrl-R or Ctrl-S respectively.
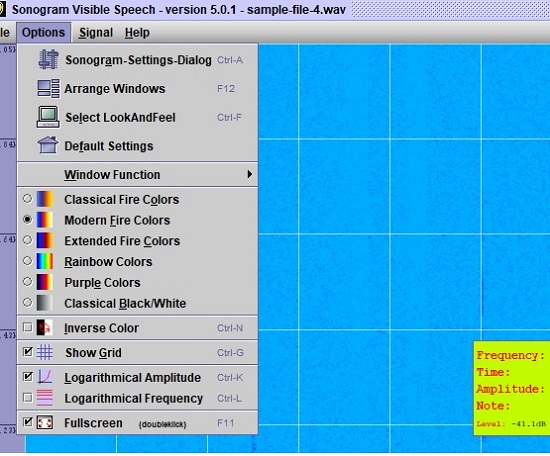
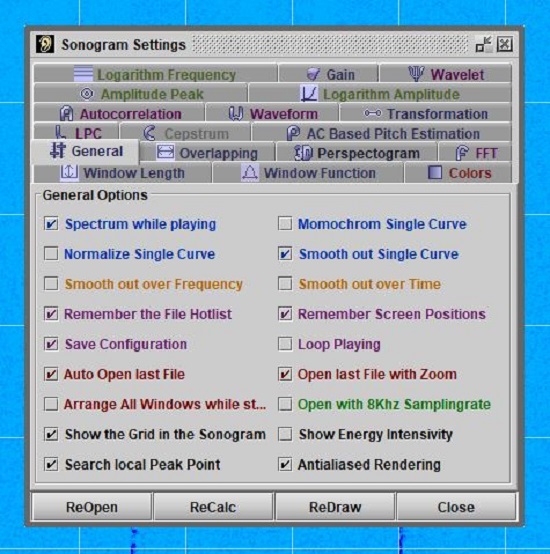
6. You can configure the Settings related to the Spectrogram such as Color selection, Color array options, Waveform, Transformation and more using the ‘Options’ menu or by clicking on the ‘Settings’ icon in the toolbar.
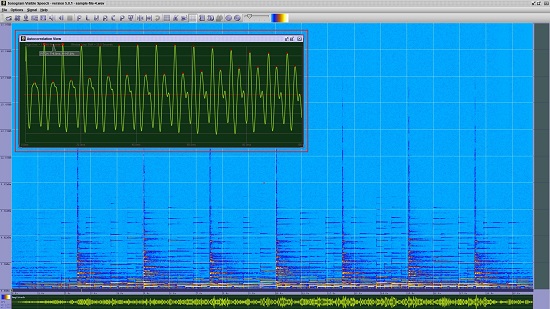
7. Sonogram Visible Speech offers many views to analyze the speech or sound such as FFT Analyzer, Waveform, Linear Prediction, Cepstrum, Autocorrelation and more. You can enable these views by clicking on any of the corresponding icons in the toolbar.
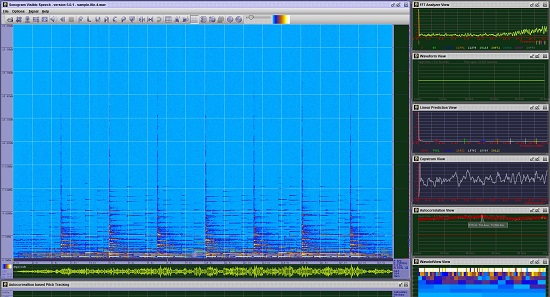
8. Alternatively, you can click on the fourth icon in the toolbar or press F12 on your keyboard to open all the analyzer windows together and arrange them optimally on the screen.
9. For more information about how you can use Sonogram Visible Speech and its Features, click here for a knowledge-base in PDF format.
Closing Comments:
Overall, Sonogram Visible Speech 5.0 is a great application to analyze speech and sound using Spectrograms. It also supports a variety of analyzers such as FFT Analyzer, Waveform, Linear Prediction and more that help you in detailed speech research.
Go ahead and try out the tool and do write to us on what you think. Click here to download Sonogram Visible Speech form GitHub.
Click here to explore 5 Free Websites that you can use to generate and analyze Audio Spectrograms online. Some of the websites allow you to play an audio file and generate the spectrogram in real time while others only generate a static image of the spectrogram.