Slope Fields, are apps which take first order differential equation and give you results in a graphically represented format. Slopes fields are also called Direction Fields. The slope field shows the slope of the differential equation at specific vertical and horizontal intervals in the X-Y plane and can be easily used to find the approximate slope of the tangent at a point on the curve that is a solution to the differential equation. Students explicitly solving differential equations can make use of the slope fields to verify that the explicit solutions are in keeping with the graphical ones.
In this article we will be exploring 5 websites that you can use to plot the Direction Fields by specifying the first order differential equations and then visualizing the numerical solutions to the equation and how they vary across the field.
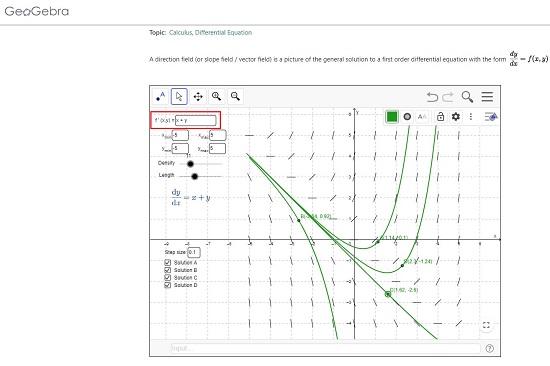
1. GeoGebra Direction Field Plotter
GeoGebra is a dynamic mathematics software for all levels of education that combines geometry, algebra, spreadsheets, graphing, calculus etc. in one powerful engine. In addition, it also offers an online platform with more than 1 million free classroom resources created by the online community.
Just click on the link that we have provided below to navigate to the Direction Field Plotter. Enter the first order differential function in the input box at the top left and specify the minimum and maximum X & Y limits of the slope field for the plot. You will be able to immediately view the direction field and the graphical solution curve in real time. You can check the solution boxes at the bottom left to draw additional curves representing various numerical solutions to the differential equation. Next, click and drag the green points (A, B, C etc) on the curve to move it freely to see how the solution alters across the field. You can use the Density and Length slider to adjust the density and length of the field lines respectively.
Use the toolbar at the top left to move the field view, zoom in / out etc. Additionally, use the tools at the top right of the plotter to configure the settings related to the coordinate axes, color, style and more. To download the Direction Field, click on the 3-lines icon at the top right of the plotter, choose ‘Download as’ and select the file type such as PNG, SVG, PDF, HTML and more.
Click here to navigate to Geogebra Direction Field Plotter.
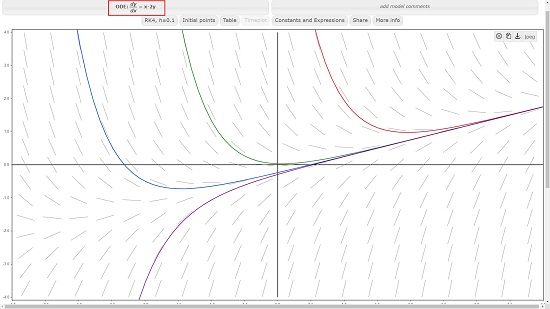
2. University of Arkansas Direction Field Plotter
Let’s move on to the next Direction Field Plotter website that may not be as powerful as Geogebra but gives a good visualization of the field and the numerical solutions.
Just type the first order differential equation in the top most field, specify the minimum and maximum limits of the slope field and the number and length of the arrows used in the field. Finally, click ‘Graph Direction field’ and it will be displayed on the page.
You can click anywhere in the field to visualize the curve depicting the numerical solution to the equation at that point. To download the direction field diagram in PNG format, right click the plot and click ‘Save image as’.
Click here to visit this Direction Field Plotter website.

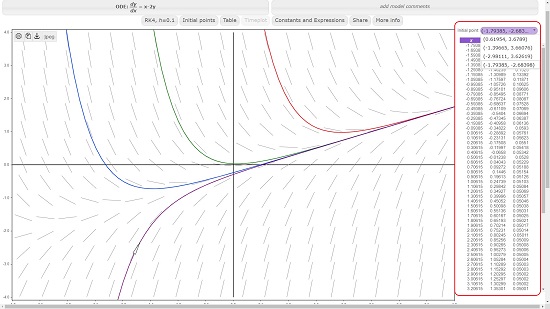
3. Bluffton University Direction Field Plotter
This Direction Field Plotter from Bluffton University is as simple and straightforward as the previous one and allows you to visualize the various numerical solution to the equation in different colors.
Just click on the link below, type the first order differential equation by clicking on the field at the top left and press enter to plot the direction field. Click anywhere in the field to graphically visualize the solution curve at that point. This website has a very handy tool called ‘Table’ that you can use by clicking on the corresponding button at the top of the plot. A table is displayed on the right side of the direction field that gives you the X and Y coordinates of multiple points along any curve representing the numerical solution to the differential equation. You can select the curve (solution) from the ‘Initial point’ drop down list at the top. Hover your mouse over the table and an arrow mark will indicate the corresponding location of the point on the curve.
To download the Direction Field diagram, click on the file format button at the top right and choose PNG or JPG and then click on the ‘Download’ icon. You can click on the ‘Settings’ icon at the top right to configure the limits of the slope field.
To use this Direction Field Plotter, click here.
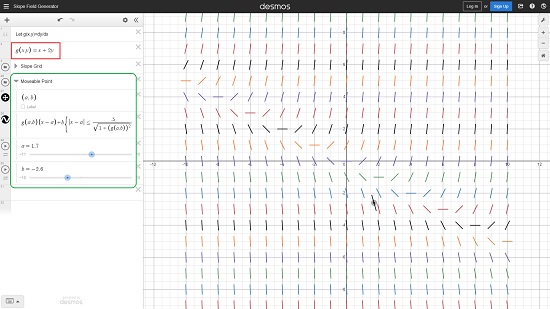
4. Desmos Direction Field Plotter
Desmos is a very popular advanced graphing calculator used by students, teachers and researchers worldwide. It has been developed in JavaScript and offers a web as well as a mobile implementation. Click on the link that we have provided below to navigate to the Desmos Slope Field Plotter.
Click on the g(x, y) field and type the first order differential equation whose slope field you wish to visualize and the field will be drawn on the screen in real time. You can click on the ‘Tools’ icon in the vertical toolbar on the left to configure the Grid, Coordinates axes, X & Y limits of the slope field and more.
To visualize how the direction of the field changes click on the arrow beside ‘Movable Point’, use the sliders (a & b) to locate any point in the field and then click on the ‘Play’ icon towards the left to analyze the direction of the slope field as the point moves across various locations. To share the Graph, click on the ‘Share’ icon at the top right of the page, copy the link and share it with others. You can also Export the Direction field in PNG or SVG format is various standard sizes. Additionally, you can also get the embed code for the Graph that you can use to embed it on any of your webpages.
Click here to visit Desmos Direction Field Plotter
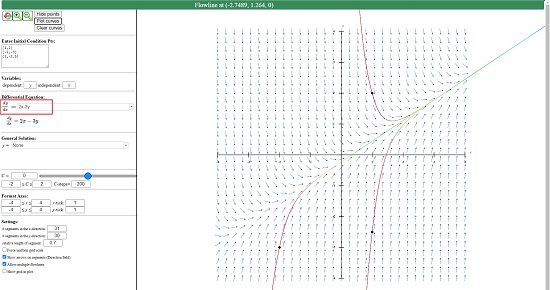
5. LibreTexts Direction Field Plotter
LibreTexts is a famous online educational resource project that provides easy and open access to related content on its website that includes open-source textbooks and simulations. Click on the link provided below to use this Direction Field Plotter.
Just type the first order differential equation in the panel towards the left of the page and press enter to plot the field. Click on any point in the field to visualize the graphical solution to the equation at that point. To mark the initial condition points, click on the button ‘Enter Points, input all the required points and click on ‘Plot curves’. You can now click and drag the condition points to see how the solution changes across the field.
You can use the ‘Format Axes’ section in the left panel to configure the X & Y limits of the scope field and the ‘Settings’ section for settings related to the number of field segments, arrow heads, grid and more.
Click here to visit the LibreTexts Direction Field Plotter.
Closing Thoughts:
All the Direction Field Plotters that we have explored above have been tested and work perfectly well. You can go through each of them and test them for various first order differential equations to see how they perform. My personal recommendation will be the GeoGebra Direction Field Plotter for the sheet amount of features and flexibility that it offers to users thanks to the power of the GeoGebra engine.