This article covers 5 free online histogram maker websites.
A histogram is a representation of the distribution of numerical data. It determines the probability distribution of continuous variables. Histograms are widely used in the HR, healthcare, marketing, sales, e-commerce, real estate, education, and other sectors where the variables are always continuous. They are the quickest way to interpret data while being descriptive rich.
With the help of these websites, you can easily make histograms online. After making the histograms, you can deep analyze them and generate shareable links to share them with others. Some of these websites, also perform additional calculation and tells you the Sum, Average, Median, Standard Deviation, etc.
Also read: Free Online Collaborative Wireframing Service with Visual Flowcharts
Here Are 5 Free Online Histogram Maker Websites:
AnswerMiner.com
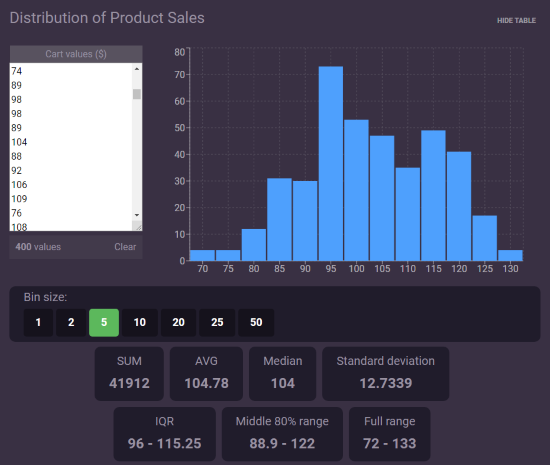
AnswerMiner is a collection of useful data analysis tools. It has an Online Histogram Calculator which you can use to visualize the distribution of your data on a histogram. To make a histogram, simply paste your data values into the value table here and make sure each value is separated by a line. As you paste your values, this tool automatically picks a bin value based on your data and plot a histogram for that. You can change the bin value if you want and the histogram will represent the updated values.
After making the histogram, you can hide the value table to analyze the histogram. By hovering your mouse cursor on a histogram bar, you can see its range along with its value and percentage. Apart from the histogram, this website also calculates the Sum, Average, Median, Standard Deviation, IOR, Middle 80% Range, and Full Range. This tool generates a shareable URL to your histogram. Anyone with that URL can view and interact with your histogram.
You can try this online histogram maker here.
Plot.ly
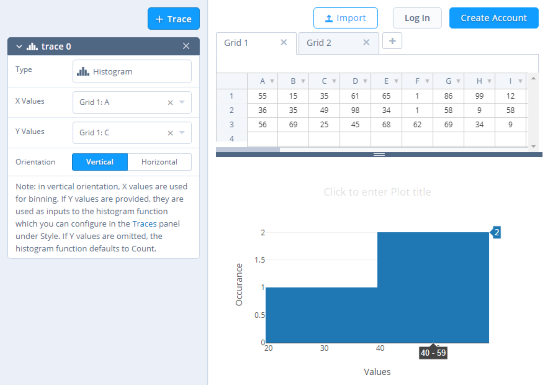
Plot.ly is an online chart studio where you can visualize and analyze data using various types of calculations and representations. To create a histogram here, go to the Structure -> Trace and select Histogram in the type drop-down. After that, enter your data in the grid which you want to represent using a histogram. You can also import data from a CSV, Excel, or SQL file. After adding the data, select the values for X & Y axes and choose the histogram orientation. Based on your data, this tool uses the x-axis values for binning and plot a histogram. You can label the histogram and both the axes here.
At the top of the histogram, there are various tools to deep analyze the histogram data. With these tools, you can select a specific segment of the histogram and zoom-in to analyze it. You can compare the data of two histogram bars as well. In the end, you can save the histogram on your Plot.ly account. While saving the histogram, you get options to make it public, private, or private with a shareable link. The private options are for premium members only.
Give this online histogram maker a try here.
Wessa.net
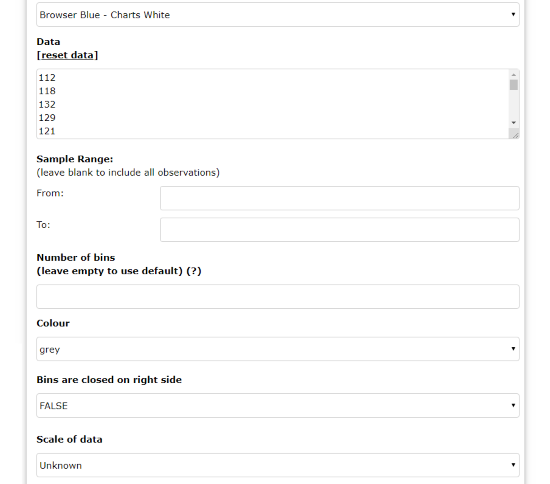
Wessa.net offers a free online tool that computes the histogram for a univariate data series. This tool has many options which you can use to generate a customized histogram. Here, you can select the histogram chart color and define the bin values for your dataset. You can select a color for bin values as well. This tool has a Sample Range option where you can define a custom range (from your dataset) for the histogram. Apart from all that, you can also define the dimensions for the histogram and label its axes.
Unlike other websites on this list, this website plots a simple histogram which you can save as PNG file. In addition to that, it also generates a frequency table where it computes Absolute Frequency, Relative Frequency, Cumulative Relative Frequency, Midpoints, and Density.
You can try this online histogram maker here.
Meta-Chart.com
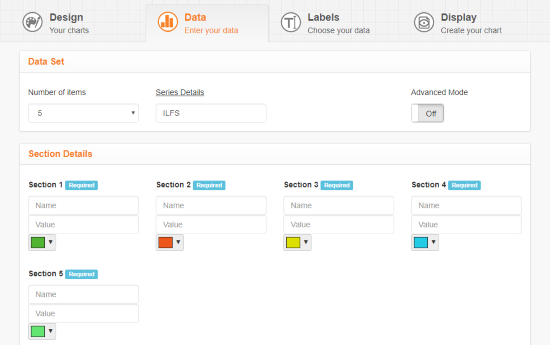
Meta-Chart is an online charting and general data visualization tool where you can create various types of charts for data representation. To make a histogram here, you have to go through four simple steps: Design, Data, Label, and Display.
In the Design step, you have to select your chart type (2D/3D), chart orientation and colors. The Data step asks you to enter your chart data. You can select the number of items here and type their value along with a color. In the Label step, you can enter the chart labels, chart names and customize the text by selecting the desired font type and font color. The last Display step visualizes all your input in form of a histogram which you can download as PNG file.
Here is the link to try this online histogram maker.
EasyCalculation.com
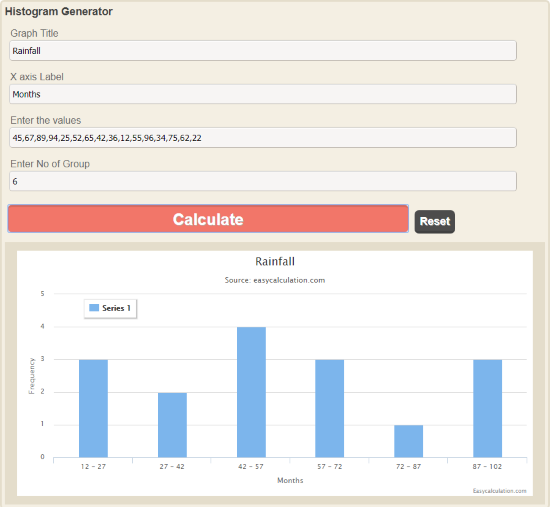
EasyCalculation offers a simple online histogram maker tool. This tool doesn’t offer any additional feature apart from a histogram. To make a histogram, all you have to do is enter your data value here in the data input text box. Use comma or space to separate each value. Then type the desired number of groups (bin). You can also type a chart name and label the x-axis. After that, click the “Calculate” button and this tool will create a histogram of your data. It’s a simple histogram, you can not interact with it. But you can generate an HTML embed code to add this chart on webpages.
Try this online histogram maker here.
Closing Words:
These are the 5 free online histogram maker websites. Depending on your requirements, you can use any of these websites to visualize your data on a histogram. If you want to deep analyze the data, try AnswerMine, Ploy.ly, or Wessa.net. Otherwise, go with Meta-Chart or EasyCalculation.