RepoTracker is an online dashboard that lets you easily keep track of Commits, Issues and Pull Requests (PR) in multiple GitHub repositories. It almost behaves like a GitHub front page, with all relevant repository updates at a single glance.
A Commit is an individual change to a file. GitHub creates a unique ID for every Commit allowing you to record changes made and changes made by who and when. To let others know of changes that you have made to a particular branch in a repository on GitHub use these pull requests.
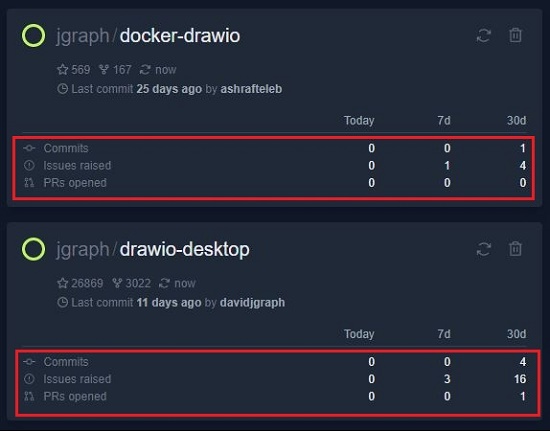
Presently, RepoTracker provides counts of Commits, Issues and PRs for the current day, the last 7 days and the last 30 days. Moreover, there are a number of helpful links on the Repository Cards that can quickly get you more details directly on GitHub. For example, clicking on ‘Commits’ for a particular Repo Card, directly takes you to the ‘Commits’ page for that repository. You can also click on ‘Issues Raised’ or ‘PRs opened’ to go to the relevant pages of GitHub.
You need to Sign In with a GitHub account in order to overcome the limitation 60 GitHub requests by RepoTracker every hour.
We tested this website for a couple of GitHub repositories and found that it gives a good insight and statistics without actually navigating to them. Here is how it works:
- Visit RepoTracker from the link provided at the end of this article.
- Sign In with a GitHub account.
- Copy-Paste the URL of the Repository in the space provided and click Add.

- A Card of your Repository is added providing you the required statistics on Commits, Issues, PRs etc. in different timelines.

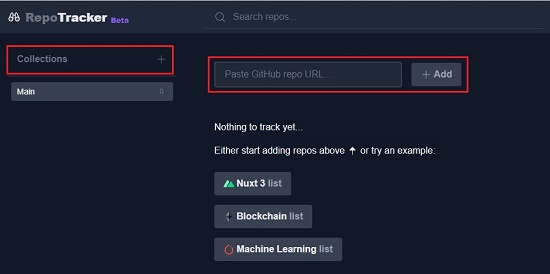
You can organize your Repository lists in the form of a named ‘Collection’, save it in a local file and share with others. Your Collections are visible on the right panel of your interface.
Verdict:
RepoTracker is an excellent tool for tracking essential statistics on GitHub Repository Commits, Issues and more. The developers could enhance its usability and appeal by providing some more pieces of Repository information and statistical graphs and charts pertaining to the numbers, in order to give it that visual look.
Go ahead and try it out from this link.