This article covers a new freeware from Microsoft, Chart 3D. This is a Windows 10 app that lets you plot 3D bar graphs, line charts, scatter plot and geospatial plots. This app is developed by Microsoft India Development Center situated in Hyderabad, India.
Charts 3D lets you visualize MS Excel and CSV data in interactive 3D graphs. You can zoom with the mouse wheel and rotate it in the 3D plane to view from various angles. You can also switch the chart columns to visualize different stats from a dataset. This app also lets you capture the charts as PNG images which you can use in presentations and elsewhere.
Also read: Windows 10 Drawing App to Draw Symmetrical Sketches
Plot 3D Bar Graph, Line Charts With Chart 3D
Charts 3D takes the advantage of 3D and MR (Mix Reality) to create attractive and engaging 3D charts. The UI of this app has various tools spread throughout the interface with a big visualization area in the center. On the left side, it has various file-related options to create a project, open a saved project, import data and export visualizations. The export visualizations option lets you export your chart as a .bin file. On the right side, it has tools to change, manipulate, and filter the visualizations. On the left-bottom side, it shows your current spreadsheet/CSV data file. And, on the top side, there are options to toggle 2D and 3D modes and visualize various planes individually. There is also a camera icon and a mic icon. With the camera icon, you can capture the current visualization and save it as a PNG file. And, the mic is for voice commands which you can use to manipulate and interact with visualizations using simple voice commands.
Here are the types of chart visualizations you can create with Charts 3D:
Scatter Plot
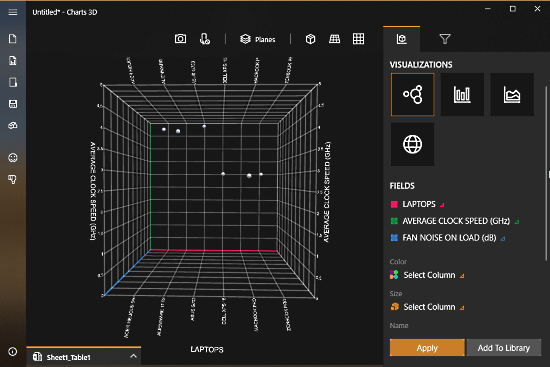
This visualization option is to create a scatter plot of your data in a 3D plane. Here, you can select the data columns for the x,y,z directions and visualize them in 3D. You can also create connected lines visualizations by selecting a group column and an order column. There are some optional fields as well where you can select columns for the color, size, and names.
Bar Chart
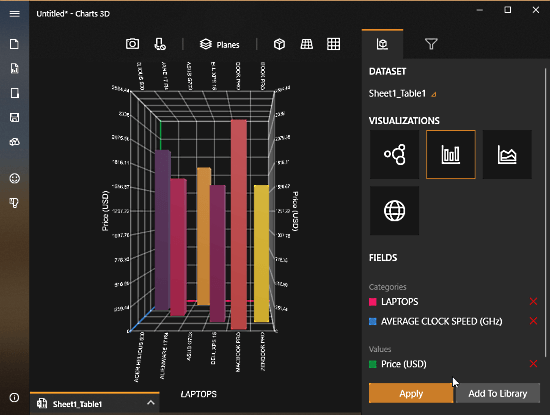 This visualization option is for creating a bar graph of your data. Here, you can select two categories of data columns from your dataset and set a value column to create a 3D bar graph.
Line Chart
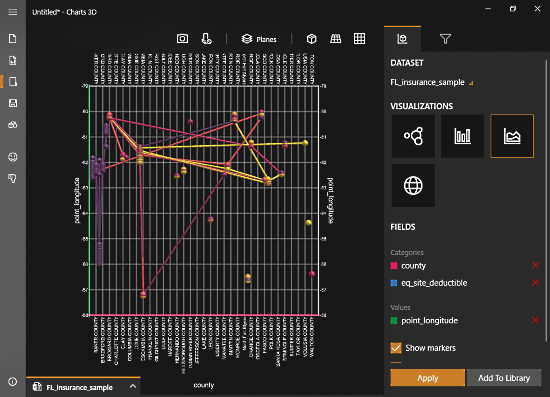
The Line Chart visualization option is to plot a connected lines visualization of two data columns. Similar to Bar Graph, you can select two categories columns for this visualization along with a value column. You can visualize this Line Chart in both, 2D and 3D and show/hide the markers as well.
Geospatial Plot
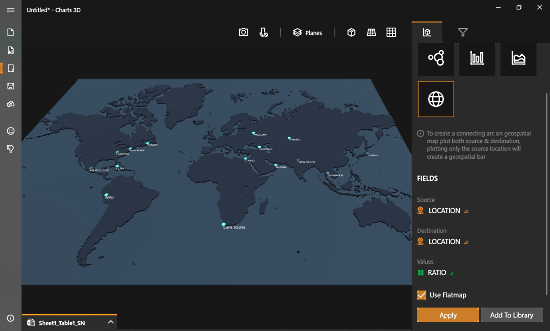
With Geospatial Plot option, you can plot your dataset on the map. Simply select the source and destination columns from your dataset along with values column and click the “Apply” button to visualize that data on the map. You can either use a rotating spherical Earth map or use a flat map for this visualization. With the Add to Library button right next to Apply button, you can pin the current visualization to the left side for later reference.
Charts 3D supports the Excel 2007 and later spreadsheet format for data import. The formula column and pivot table are also not yet supported in this app. Apart from the spreadsheet, you can import data from a CSV file as well.
You can download Charts 3D from Microsoft Store here.
Closing Words:
Chart 3D is a nice app for making interactive and engaging 3D charts. It is comparatively lighter than other 3D visualization options and can easily run on budget-friendly Windows 10 S devices as well.