Spotifystats.pages.dev is a cool free website that allows you to visualize your Spotify history. All that you need to do is import your own data from Spotify and upload it to the website. In just a couple of seconds, you can get complete statistics and insights about your top artists, songs, genres and more in a neat design replete with colorful charts that make it easy for you to visualize your data.
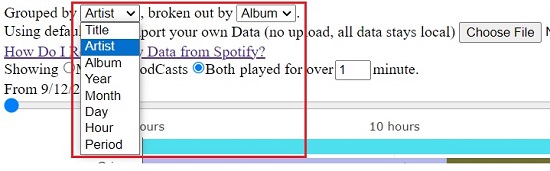
Once you upload your Spotify data, you can use the sliders (from & until) at the top of the page to define the time ranges. Additionally, you can also use the two drop-down lists at the top of the page to group and further break down the data by Title, Artist, Album, Year, Month, Day, Hour, and Period.
Working:
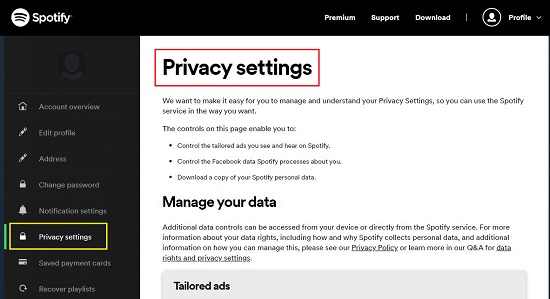
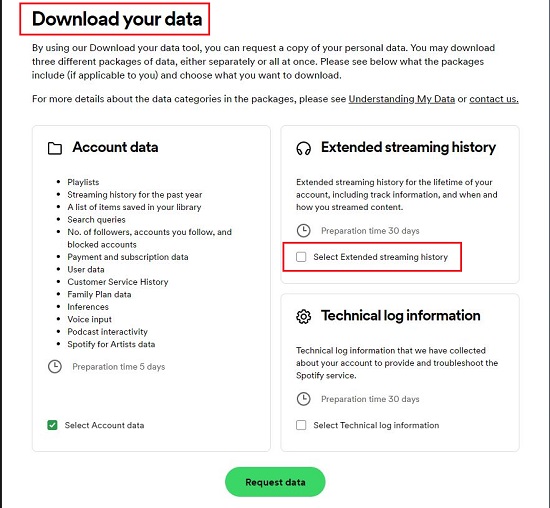
1. As stated above, this website requires you to import your own Spotify data. For this, login to your Spotify account and from the ‘Profile’ menu at the top right corner, click on ‘Account’. Next, click on ‘Privacy Settings’ in the left side panel, scroll further down the page and, enable the checkbox ‘Select Extended streaming history’ and then click on ‘Request Data’. It may take a week or more for the data to be sent to you in your inbox. Note that the basic Account Data will be emailed to you initially before you get the complete Extended Streaming History.
2. Once you receive the email from them with the Extended Streaming History, click the download link and you will be navigated to a Spotify page where the data download will start automatically in Zip format. Unzip the file and locate the JSON data with a file name that reads ‘Streaming_History_Audio_{…}-2023.json’.
3. Now, click here to navigate to Spotifystats.pages.dev and you will be able to visualize some cool Spotify stats using default data. Click on the ‘Choose File’ button and upload the JSON file that you unzipped in the previous step.
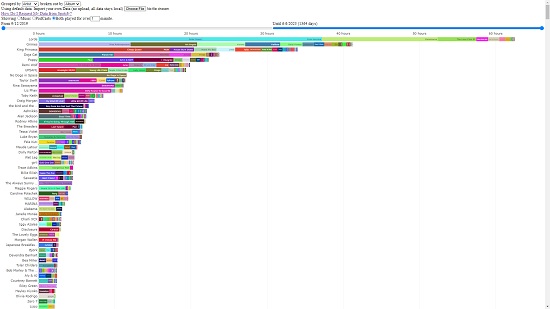
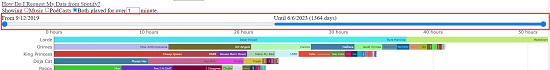
4. You will now be able to visualize your own Spotify history with complete statistics. You can use the drop-down lists at the top of the page to group as well as break down the data based on Title, Artist, Album and more.
5. To adjust the time ranges for which you want to visualize your Spotify data, use the From and Until sliders at the top of the page.
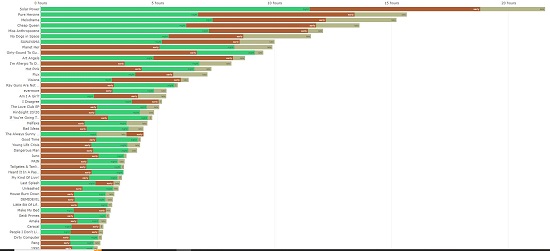
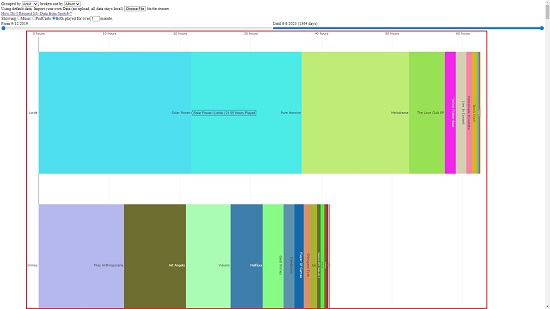
6. To zoom in and visualize the chart in greater detail, just click and drag the mouse to mark an area over the desired place. To return to the default zoom level, double click any part of the screen.
7. To choose to display the statistics of Music, Podcasts or Both, select the corresponding radio buttons at the top of the page.
Closing Comments:
Overall, this looks like a cool web application that enables you to visualize your Spotify History so that you can gain key insights about your top artists, songs, albums and more using color charts. The only catch is that you must import your Spotify data as instructed above which takes a week to ten days to be processed.
Click here to navigate to Spotifystats.pages.dev