Heartcount is a cloud-based free data analytics tool that empowers users to perform a code-free and detailed analysis of your data easily and quickly. The tool is based on the design principle that allows users to define, investigate and summarize any given dataset at the speed of their thoughts without any constraints set by the data architecture. Hence, the users can entirely focus on asking the pertinent questions to the data and studying what has been revealed on the screen completely oblivious to the underlying technology systems.
Heartcount readies and stores the entire dataset and the related metadata in the browser’s memory. Hence, without any significant delay, the user can persistently ask questions by effectively mapping new variables to the coordinate axes, change the color, size, style and more. The visualization engine of Heartcount comprehends the questions put forward by the user and quickly renders the respective visualization in real time. In fact, Heartcount is capable of interactively visualizing more than 10 million individual records instead of simply displaying aggregated data.
Features:
Smart Plot
This is one of the most important features of Heartcount where visualization tasks that are basically code-heavy and intensive can be executed quickly and easily. All that you are required to do is to select which variable should attach to the X axis and which one goes to the Y axis and select the type of visualization that you wish to use.
Smart Plot offers a variety of data visualizations such as Scatterplot, Heat scatter, Regression line, Stacked bar, Stacked area, Ratio bar chart, Stacked count bar and more.
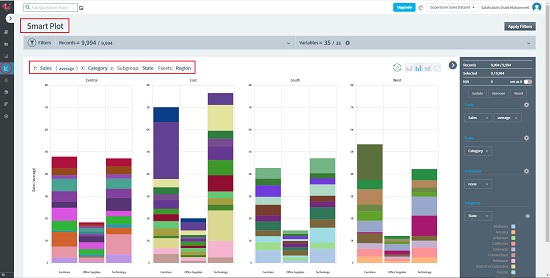
In addition to the above, Smart Plot also provides an additional feature called Facetting by virtue of which you can divide a single plot into multiple charts centered on a facet variable so that you can have an improved understanding of the relationship between the x and y variables.
Click on this link to learn how to use Smart Plot.
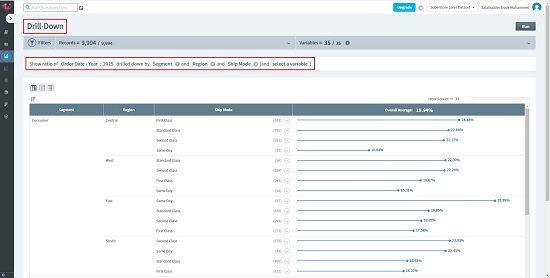
Drill Down
This prominent feature enables you to easily calculate, summarize and analyze the data with a focus on finding the main similarities, hidden patterns, and the overall trends of the key metrics of the data. Using Drill Down you can segregate your data into multiple dimensions by easily choosing which variable you desire to segment the data. Additionally, Drill Down awards three ways to represent the drilled down data that gives you a detailed understanding of the entire dataset.
To learn how to use the Drill Down feature, click here.
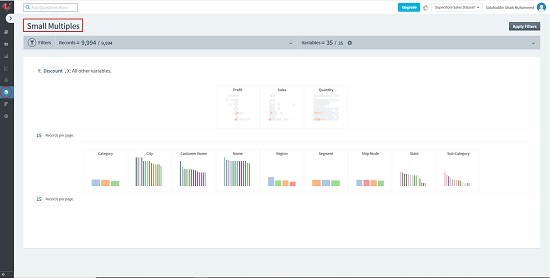
Small Multiples
This feature provides a bird’s eye view of a solitary numeric variable over all the other variables in your dataset. This helps you to instantly comprehend the overall relationship between the chosen variable and the other variables by presenting the relevant charts.
Click here to learn more about Small Multiples.
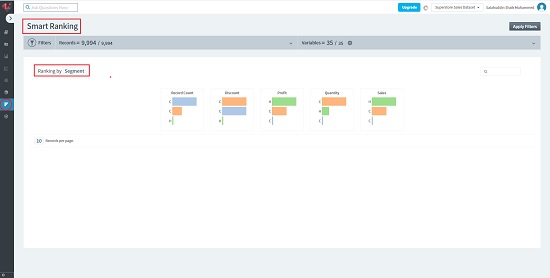
Smart Ranking
Smart Ranking assists you in the quick generation of multiple bar charts based on the complete set of numerical values such as (sales, weight, costs and more) in a chosen dataset over a categorical variable (like product categories, ids, types etc) that you select. This provides you with a broad view of the dataset and simplifies its understanding to figure out which group generally possesses more numeric values.
Click here to learn how to use this feature
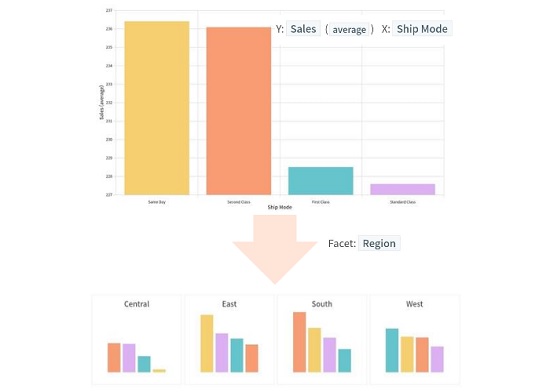
Smart Facets
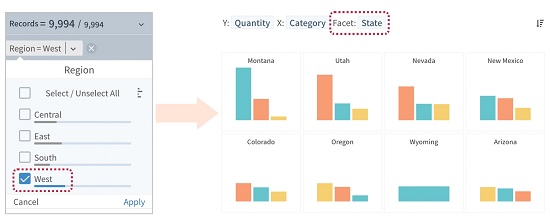
Smart Facets is an extremely useful feature of this tool that enables you to better comprehend the relationship between two variables. This is done by creating multiple facets with the selected facet variable. For example, if you desire to generate a bar chart of sales in relation to ship mode and how it varies with respect to regions, all that you should do is select ‘region’ as the facet variable in Smart Facets.
In Smart Plot you can select a categorical variable as a facet variable only if it is less than 11 levels. On the other hand, Smart Facets enables you to utilize any categorical variable with greater than 11 levels.
Click here to learn the usage of Smart Facets
Closing Comments:
Overall, I found that Heartcount makes it extremely easy to do exploratory data analysis. Personally, I found the data visualization feature of Heartcount is very impressive apart from the Smart Plots that are extremely interactive and are easy to use. Heartcount also offers several supported analytics to optimize your KPIs and makes the process of regression analysis fairly easy and straightforward.
The product is extremely simple to use even for those who do not know much about the process of Data Analysis. Click here to navigate to Heartcount, register for a free account and start analyzing your data. There are also a couple of sample datasets available for you to try out the product and its features.