Climate Change refers to long-standing alterations in Global temperatures, rainfall and related weather patterns due to natural causes like variations in the solar cycle but, more importantly due to excessive reliance on fossil fuels like coal, petroleum and gas.
As a result of climate change, severe droughts, heat waves, melting of glaciers, rising of sea / ocean levels etc. have become more common and aggressive. These can directly harm animals obliterate their habitat and wreak a havoc in the livelihoods of large communities.
It is highly imperative and crucial that these permanent changes to the climate particularly temperature, precipitation, freak weather patterns etc. are closely monitored and tracked. This will help us forecast rains, heat waves, rising sea levels and so that preventive action can be taken.
In this article we will be briefly reviewing 5 Climate Change Trackers that especially track changes in Global Temperatures.
1. Climate Change Tracker
The Global Warming Dashboard of this website gives us a deep and precise understanding of world temperatures and the anomalies since 1850. Several key data metrics and points have been captured and presented visually in the form of self-explanatory colorful charts such as Yearly average temperature and its anomalies, Rate of temperature change over the years, Earth’s energy imbalance and more.
You can hover your mouse over most of the charts to get a precise reading for that particular year. To gain more information about any dataset, you can click on the ‘More info’ icon at the top right.
On the whole, this website gives a bird’s eye view of Global Temperature change since the past 175 years or so. There is no provision for tracking these changes for individual nations.
Click here to navigate to Climate Change Tracker
![]()
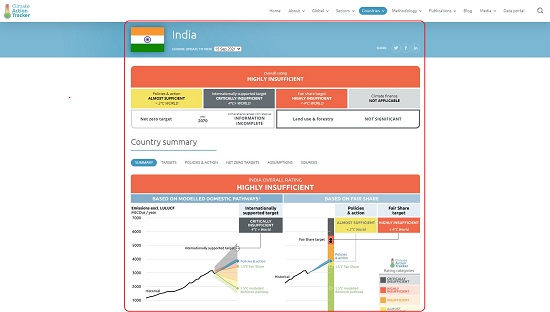
2. Climate Action Tracker
This is a different type of Climate Tracker that tracks the actions and measures adopted by various governments and compares it with the globally agreed and acceptable target of limiting global warming to below 2°C, and trying the utmost to bring it down to 1.5°C ( as per Paris Agreement)
You can search for any country or select it on the interactive map. It will immediately provide the overall rating for that country. Alternatively, you can study its full profile which provides metrics on Emissions, Policies and Actions, International & Domestic targets and gaps and more. You can also choose to download all the data and use it for your studies and presentations. Information on ‘How to read the Graph’ has also been provided since few metrics are quite complex to understand and interpret.
Overall, Climate Action Tracker is a unique and highly informative website to figure out where each nation stands with regards to limiting Global Warming as per the agreed upon benchmarks that were mutually decided in the Paris Agreement.
Click here to head to Climate Action Tracker
![]()
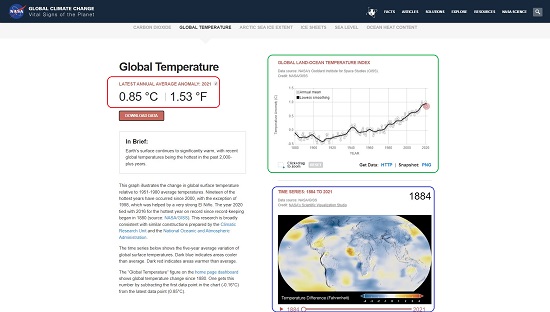
3. NASA: Global Climate Change
NASA’s Global Climate Change is a website that comprises of a vast collection of climate and global warming resources for educators, weather forecasters and more. The Dashboard contains metrics on Global temperatures, Greenhouse emissions, Sea levels, Arctic sea ice extent etc.
An interactive chart has been presented with data on Global land-ocean temperature index. You can click drag this chart to zoom in to a certain period from 1880 to the present day. The website also gives a real time figure of the Average annual anomaly.
A time-lapse intuitive video on Global Temperature Differences since 1884 has been provided for your information.
Overall, this is a good website to track change in Global Temperatures although the metrics are not as exhaustive as the first website in this list.
Click here to visit the website Global Climate Change from NASA.
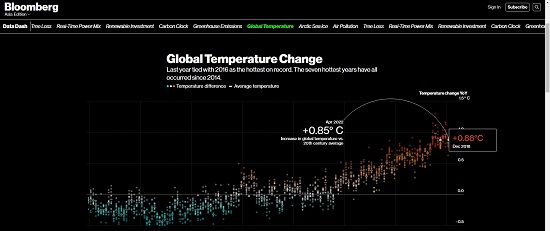
4. Bloomberg Data Dash
This is yet another website with the latest global temperature data based on information provided by NASA. Apart from Global Temperatures, the website provides key metrics and charts for a variety of parameters like Arctic sea ice, Greenhouse emissions, Carbon clock, Tree lost and many more.
The Global Temperature Change curve is very informative and interactive. Hove your mouse over any specific year, and it depicts the temperature change for that year with respect to the baseline.
There is yet another interactive chart that has been provided which gives the monthly Global Temperature Change since 1880 to the current year.
All in all, Bloomberg Data Dash is a good website to track changes in Global Temperatures since 1880. No country specific data has been provided.
Click here to get redirected to the Bloomberg Data Dash
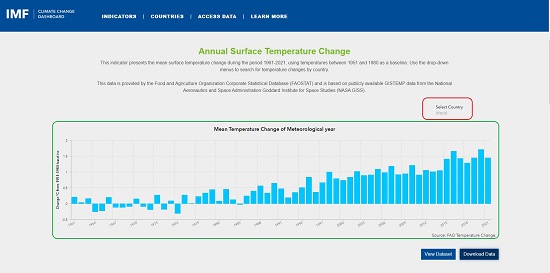
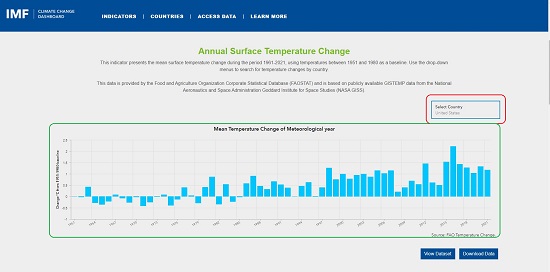
5. IMF Climate Change Dashboard
This Dashboard provides Climate Change metrics on Annual surface temperature change, Atmospheric Carbon dioxide concentrations, Mean sea level change and more.
You can view the Global temperature change since 1960 to 2021 using a baseline from 1951 to 1980. You can use the drop-down to visualize country specific data. Hovering your mouse on any specific bar gives you the reading for that year. You can also view the dataset and download the data for further research and presentation.
Click here to access the IMF Climate Change Dashboard.
Global Warming and Temperature changes are a fact that nobody can deny and monitoring and tracking them is extremely crucial to determine future climate expectations. The dashboards presented above give a key understanding of the changes to the world climate and can be efficiently used to learn and track these changes.