Graphs Made Easy is a very efficient and free graph making tool which helps in creating graphs and charts with a simple data input as well as using imported data. This free graph creator comes with powerful editing parameters which are very easy to use considering the efficiency it comes with. You no longer would have to try using complex excel tables or office data to create your graphs once you start using this free graph making software.
Installing this Free Graph Making Tool.
To install this free graph making software and use it on your system, you would be required to visit the site here and download the application. Once you have the installer downloaded on your system you just need to run the installation process. Going through the step by step process you will have this free graph creator ready to use on your system in couple of minutes. If you are interested to check out some similar software to make your presentations more attractive, you can try PowerPoint Graph, yEd Graph Editor and TimingEditor.
User Interface of Graphs Made Easy:
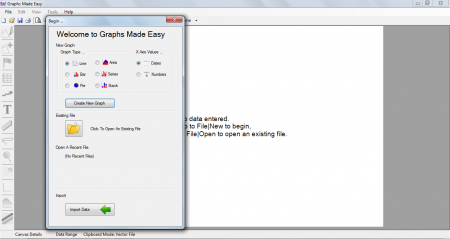
Once launched, this free chart editor comes with two windows on the screen. The upper window provides you the option to select the graph you wish to create. The option to open an existing file, open recently created files, and the tab to import data from your previously created files on applications.
Using Graphs Made Easy:
In order to start using this free graph making software and create the graphs, you have to select the radio button against the type of graph you want. For example you can choose a line graph, Area Graph or a Bar graph. The next thing to do would be to select the X axis values. This could be the dates or numbers. This would bring you to the main screen of this free graph creator. Here you would be required to insert the data which you wish to be reflected there
in your graph.
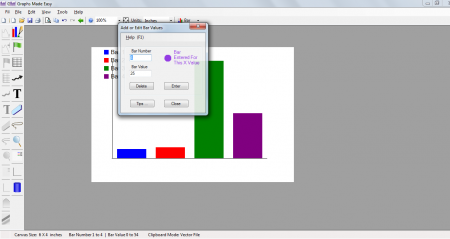
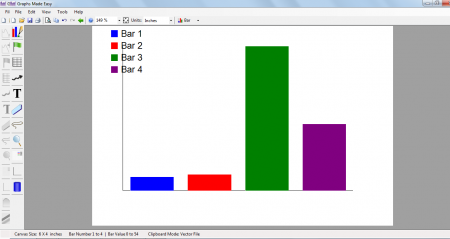
The left side of the system gives you the tools through which you could insert the data, colours, text, etc. to the graph you are creating. Clicking on the first option you can insert the bar number and the value to the bar. Keep on inserting the bar number and data as many times you wish to insert a particular set of data and the chart would be created on itself. Further you may select the options on the left depending on the purpose you have. You may delete a bar or a section of your graph by selecting the eraser tool on the left.
You may import data from an existing .gme file which is possible by clicking on import data option under the file option. Moreover, if you have an already created graph and wish to edit it you can click on open from the file drop down and the graph would open in the main screen.
The type of graphs which you can create using Graphs made easy are:
- Line Graph
- Bar Graph
- Pie Chart
- Area Graph
- Series Graph
- Stack Graph
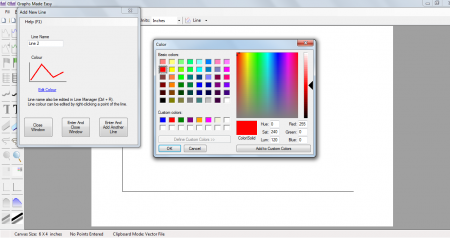
You may insert a new line to your graph by clicking on Add new line in your graph. This would be the secondary line which is very effective to compare data in a graphical form. You may select the colour which you wish to represent the secondary line.
Lastly when you have your graph ready, you just need to save the file using the save as option in the file drop down. Overall, there are many more things which you could do with this free chart editor to create your personalized graphs. It easily simplifies the process of creating charts which might have been very difficult for you in the past using the complicated options available in the Microsoft office software. Download and try Graphs Made Easy for free.