This article covers 3 free online stock charting tools for stock analysis. If you are into stock market analysis then having an information-rich charting tool is very important. A stock charting tool helps you build a trading acumen. You can find lots of stock charting tools on the internet which are mostly paid. There are a few free tools as well but they generally provide data from a single source.
Here I covered 3 stock charting tools which are free to use and offer detailed information from various sources. These stock charting tools can show the stock trade data in form of a bar graph, line chart, candle chart, and other chart forms including Heikin Ashi, Line, Area, Baseline, Renko, and Line Break. With the help of these charting tools, you can custom charts for stock price changes and do the stock analysis.
Also read: Get Free Daily Stock Updates Powered By Social Sentiments, AI, Neural Networks
3 Free Online Stock Charting Tools For Stock Analysis:
TradingView.com
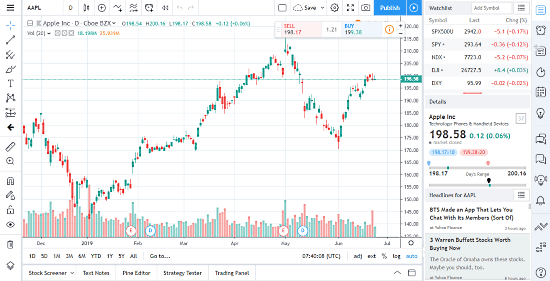
TradingView.com offers one of the best stock charting tool that is free to use. This tool shows you a detailed stock trade data on the chart along with various tools to analyze every small bit of the chart. From the top left corner of the chart, you can select or enter a stock name to chart it’s stock price changes. Once you select the stock, it generates a stock chart covering the last 2 years. You can change the chart form to Bar, Candle, Hollow Candle, Heikin Ashi, Line, Area, Baseline, Renko, Line Break, Kagi, Point & Figure, and Range.
This stock charting tool has two sets of tools on each side of the chart. The panel of the left side of the chart contains tools to closely analyze, annotate, and mark the stock price. Whereas the panel of the right side contains productivity tools that come handy while analyzing stocks. These tools are
- Watchlist
- Alerts
- Data Sheet
- Hotlists
- Calendar
- Note taking
- Public & Private Chat
All these tools help you filter, compare, and analyze the stocks. It also packs a screenshot button which you can use to capture the stock chart at any given time. This stock charting tool also has a paid tier where you can get an ad-free experience with other cloud-based account features like chat, favorite charts. personalized alerts, etc.
Give this online stock charting tool a try here.
StockCharts.com
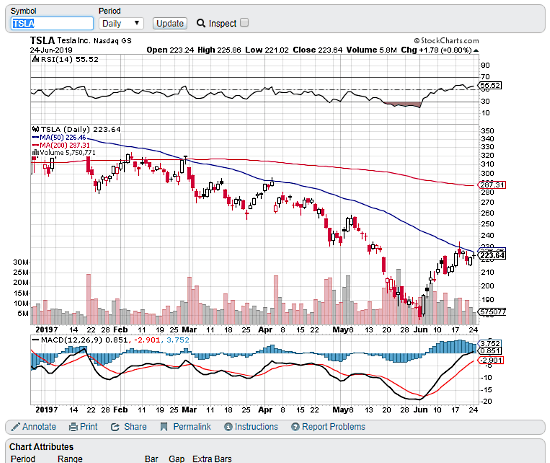
StockChats.com also offers a comprehensive stock charting tool which you can use for free. This complete tool with all the personal account and cloud options feature is paid but you can use the chart free for analysis. Similar to TradeView, you can enter a stock name at the top left corner and plot a stock chart for it. Here, you can sort the chart for daily, weekly, monthly updates to manual stock changes and view the following chart forms:
- SharpCharts
- PerfCharts
- Point & Figure
- CandleGlance
- Seasonality
- GalleryView
- MarketCarpets
- RRG Charts
- Dynamic Yield Curve
For a detailed impact analysis, you can customize the chart attributes for a personalized chart. Then, you can use the annotation tool to mark the chart and save a PDF version of it. You can also create a permalink to your stock chart and share it with others.
Give this online stock charting tool a try here.
Finance.Yahoo.com
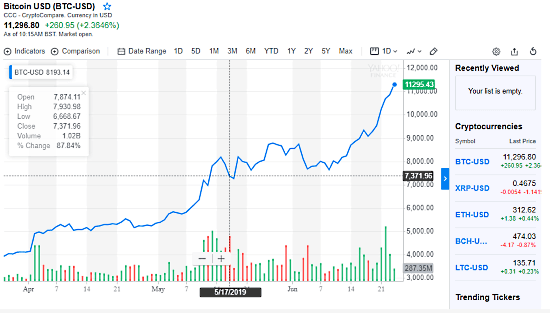
Last, but not least, you can also use Yahoo Finance for stock charting. You can simply visit the Yahoo Finance homepage and search a stock name there which you want to track. In the results, it shows you the following stock and market information of that stock:
- Summary
- Chart
- Conversions
- Statistics
- Historical Data
- Profile
- Financials
- Analysis
- Options
- Holders
- Sustainability
The Chart section shows the stock chart where you can track the stock movements for up to five years. Here, you can view stock in Line, Area, Candle, Hollow, Candle, Bar, and Colored Bar and filter for a specific date range. You can also add indicators and compare charts of different stocks. On top of that, you can sign in with your Yahoo account and use the stock screener and watchlist features which comes handy for stock analysis and trading.
Give this online stock charting tool a try here.
Closing Words:
These are the 3 online stock charting tools which you can use for free. These tools provide you accurate information with constant updates which you can closely analyze and build a trading acumen. Give them a try and share your opinion with us in the comments section below.