This article covers 10 free online line chart maker websites.
A line chart or line graph shows the information as data points connected by straight line segments. The data points are plotted on a graph corresponding to two functions. Line charts are commonly used in many fields such as business, sales, marketing, education, research, study, etc.
Here are 10 free websites to make line chart online. These websites offer simple line chart maker tools. You can input your data to these tools and make a line chart within a few clicks. These tools also let you tweak the appearance of the chart. They provide you options to color code the data sets, choose the font for the labels, add a background color, and so on.
Also Read: Free Online Chart Maker to Create Animated Charts of Simple Data Sets
Here Are 10 Free Online Line Chart Maker Websites:
Plot.ly

The first website on this list is Plot.ly. It is an online chart studio where you can make various types of charts including simple charts, distribution charts, 3 charts, finance charts, specialized charts, and more. This chart studio has a nice UI with a big canvas are and a menubar at the left. The canvas is divided into two sections; one with a grid to input data for the chart and other to show the chart preview.
To make line charts with Plot.ly, go to Structure menu and select Line Chart type under Traces. Then enter your chart data in the gird column-wise. If you have the data saved in an Excel, CSV, or SQL file, you can import it directly here. Once the data is added, select the functions for the line charts. Choose dataset(s) for the x-axis and/or the y-axis. As you chose the data set, Plot.ly will immediately show that data on the chart.
Apart from making charts, this tool packs various style options which you can use to customize your chart. You can also annotate the chart and add shapes and images to it. Once the chart is finalized, you can save it publically to your Plot.ly account or export it as a PDF, PNG, JPEG, or SVG file.
Make line chart online with Polt.ly here.
Meta-Chart.com
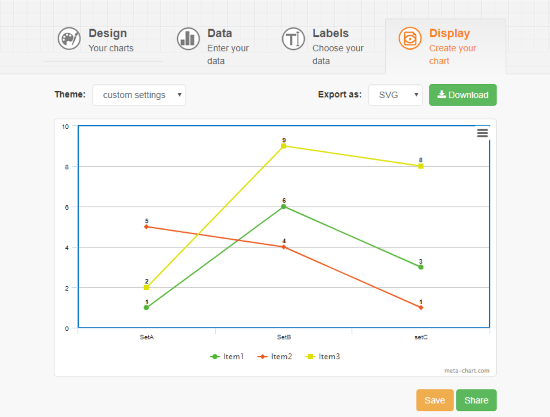
Meta-Chart.com is an online charting and general data visualization app. With this web app, you can make around a dozen types of charts online. It has a 3-step process to make charts; Design, Data, and Labels. To make the line chart here, first, go to Charts Types and select the Line Charts. Then, follow the 3 steps to add information for the chart.
The first step is Design where you can set the color preference for the chart. You can choose a background color, border color, and legend position for the chart. The next step is Data where you have to enter your data which you want to represent in the line chart. Here, you can select the number of groups and items you want to add in the chart, enter their values. You can color code different items as well. After the Data, the next step is Labels. In this step, you can label the axis of the chart and choose a font, font size, and font color for the labels. Once, you complete these steps, Meta-Chart makes the chart from your data. You can view this chart in the Display tab. If you want to make any changes to the chart, you can go back to respective step and make your changes. From the Display tab, you export the chart as a PNG, PDF, or SVG file. You can also save the chart to your Meta-Chart account and generate a shareable URL to it.
You can try this online line chart maker here.
OnlineChartTool.com
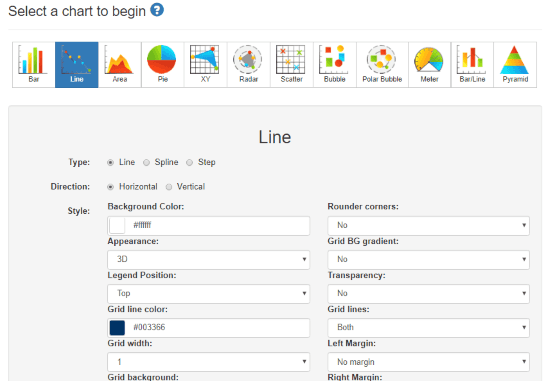
As the name suggests, OnlineChartTool is an online charting tool where you can make 12 types of charts. Similar to Meta-Chart, this tool has a 5-step process to make chart online; Design, Data, Labels, Preview, and Save & Share. The last two steps are just to preview and save the chart so, actually its also a 3-step process.
In the Design, you can pick various design parameter for the line chart. With this tool, you can represent the data points of the line chart as Line, Spine, or Step. You can also choose a direction (Horizontal or Vertical) for the line chart. In the Data step, you can import a CSV file or manually add data by selecting the number of items and groups. You can choose a different color for each group here. In the Labels step, you can name the axis and the chart. You can choose the range and number format for both axes.
After finishing these steps, you can view the chart in the Preview step. Here, you can evaluate the chart and make changes by going back to the respective step. If everything is fine, you can move to Save & Share step from where you can email your chart to others and download it as an SVG, PNG, JPG, PDF, or CSV file. You can also generate HTML embed code which you can use to add the chart image to a webpage.
Try this online line chart maker here.
ChartGo.com
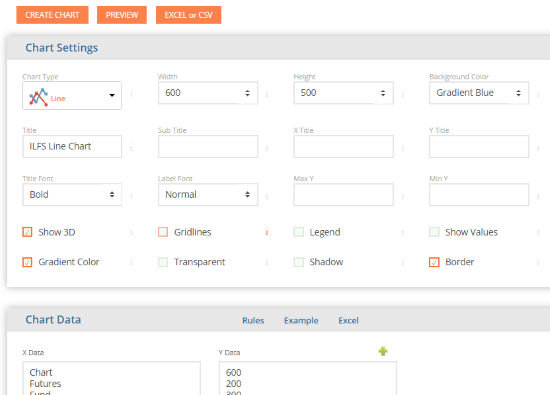
ChartGo is another free online chart maker tool. With this tool, you can create Pie, Bar, Line, and Area Chart online. When you select a line chart here, it gives you two tabs; one for Chart Settings and other for Chart Data. The Chart Settings tab has various customization options for the chart. Here, you can pre-define chart size, add labels and select chart orientation. There are 8 checkboxes to tweak the chart appearance. You can mark any of these checkboxes as per your liking.
Then, in the Chart Data tab, there are two text boxes for X and Y data. Paste your dataset in these boxes. By default, there is only one group but you can add more groups to include multiple datasets in your line chart and color code them. You can also import data from a CSV or Excel file here. After that, you can create a preview of the chart with the Preview button at the top. If everything is right, you can make your line chart by clicking the Create Chart button. After creating the chart, you can print it directly or download it as a PDF, PNG, or SVG file. You can also view the chart data and generate shareable URL along with HTML embed code.
Give this online line chart maker a try here.
LiveGAP.com
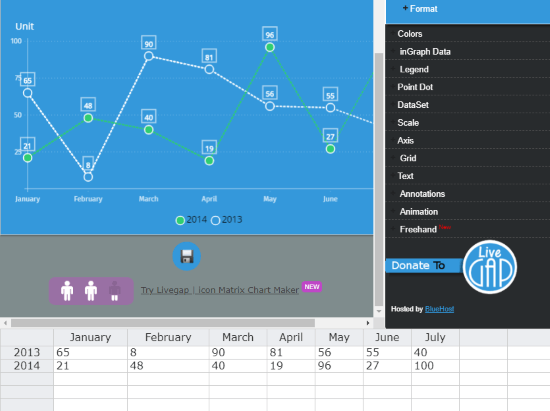
LiveGAP.com is another free online chart studio where you can make almost all types of charts. It features multiple style templates for charts; you can select any of those templates, plot your data and customize it.
In case of the line chart, LiverGAP offers you 6 different style template to choose from. To make a line chart here, select a line chart template and paste your data in the given sheet. You can also import data from a CSV or Excel file. Once you add the data, this tool plot it on the graph. You can add the legend to the chart, customize its appearance, and annotate it. LiverGAP has a free-hand drawing tool which you can use to draw/write on the chart. You can also animate the plotting process which makes the chart look cool. In the end, you can download the line chart as a PNG or HTML file.
Try this online line chart maker here.
RapidTables.com
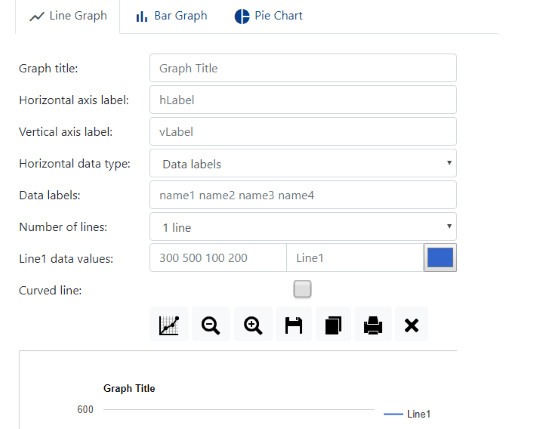
RapidTables is a free website that offers various types of online calculators, converters, and various other types of tools. It has a graph maker tool where you can make Line Graph, Bar Graph, and Pie Chart.
With its Line Chart Maker, it’s very simple to make line charts. To do that, type your data values and their labels here. You can also name the chart and labels for both axes. You can also select the orientation of the line chart. If you want to include multiple datasets in the chart, you can have multiple lines and enter the data for them. In the end, this tool makes a line chart of the input data which you can print directly or save as a PNG, SVG, PDF, or CSV file.
Make line chart online with RapidTables here.
PlotVar.com
PlotVar.com is a simple chart maker website where you can quickly plot your data on various types of graphs. This website has a straightforward line chart maker tool. You can paste your dataset in this tool and quickly plot it on the map within a click. You can also add multiple variables to your chart by adding multiple datasets.
With this tool, you can easily make line charts within a few clicks and use it to quickly plot data for analysis. And, you can also add labels and names to give the chart more professional look. At last, you can download the chart either as an SVG, PNG, PDF or a CSV file.
Make line chart online with PlotVar here.
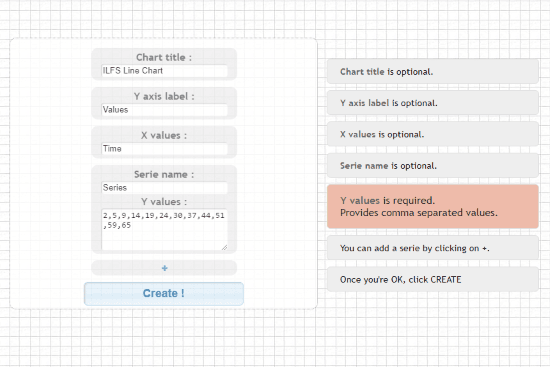
EasyCalculation.com
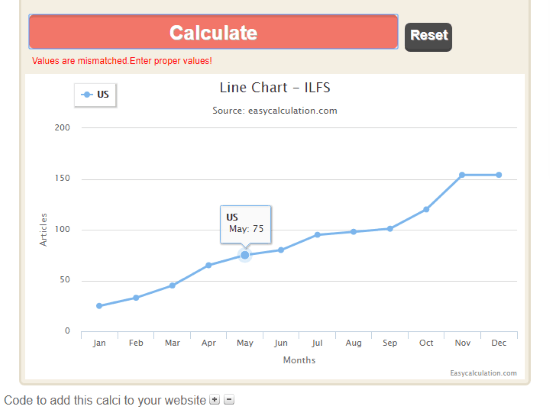
EasyCalculation.com offers easy to use tools for a variety of tasks. It has an online line chart maker tool with basic functionality. In this tool, you can add your data to plot it on the graph. Like PlotVar, you can add labels for the axis, specify legend, add a graph title. With this tool, you can make lines chart with up to 4 datasets.
The chart here is interactive; you can hover your mouse cursor over a ‘marker’ in the chart and see its value. You can not download this chart but you can generate an HTML embed code for it. This line chart maker tool gives an option to specify a chart size and gives you HTML code for that. This way, you don’t have to edit the chart later in order to embed it on a webpage.
Give this simple online line chart maker a try here.
Shodor.org
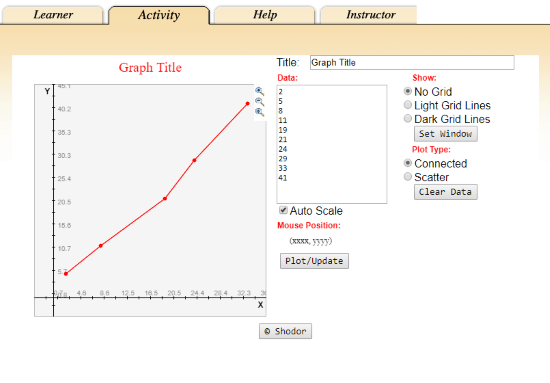
Shodor.org offers a collection of online interactive tools for a variety of tasks. It has a free graph maker tool where you can make various types of graph online. This tool has a simple user interface with a graph to plot the data and several options for inputs. You can simply paste your data in the data box here and plot it on the graph. You can add light or dark grids to the graph to make it easy to analyze. This tool is good for quickly plotting charts but it doesn’t give you any options to export the chart to various formats. You can still save the chart as an image from the right-click menu though.
Try this online line chart maker here.
MathCracker.com
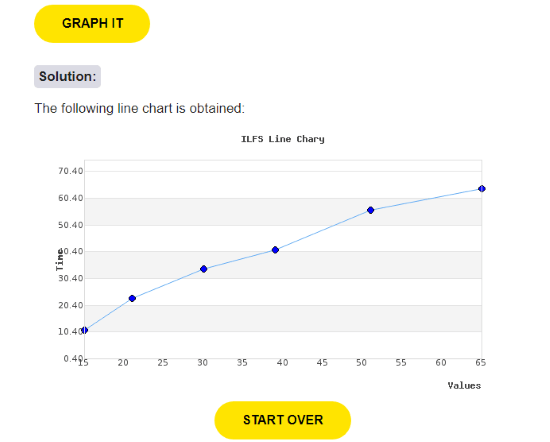
Similar to Shodor.org, MathCracker.com is another free website that offers various types of online tools such as calculators, graphing tools, etc. This website has a simple line chart maker tool where you can quickly create a line chart within a few clicks. Here, you can simply paste the data points for the X and Y axis only and plot in on the chart. You can also add a chart title and label the axes if you want. This tool is also for quickly plotting and analyzing the line chart it doesn’t offer any other feature beyond that.
Plot line charts online with MathCracker here.
Closing Words:
These are the 10 free online line chart maker websites. The process of making line chart on all these websites is simple and straightforward; you easily can use any of them to make line charts online. The first five websites on this list offer various customization options which you can use to make an attractive line chart for professional, educational, and personal use. Whereas, the last five websites offer more simple tools to make line charts with less complexity.