In this article, I will cover 10 online box plot generator websites.
Box Plot (aka Box and Whisker Plot) is a method in descriptive statistics to graphically represent groups of numerical data through their quartiles.
With these websites, you can easily generate box plot graph for your data. Simply enter your data into these tools and they will create the box plot graph for you. Some of these websites offer additional handy features like options to download the box plot in various formats. Whereas, some just simply generate the box plot representation of your data.
Also read: Free Math Calculator With Graphing Support: Euler Math Toolbox
Let’s start the list and discuss these websites one by one.
Here Are 10 Online Box Plot Generator Websites:
Shiny.ChemGrid.org
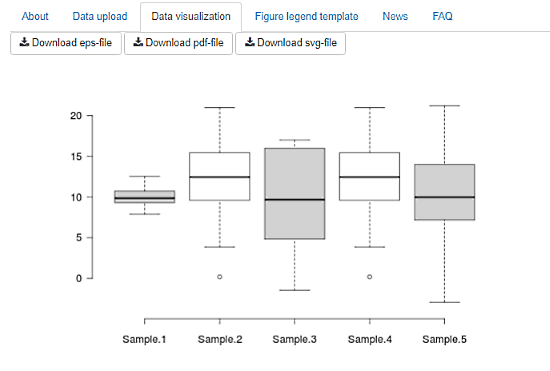
ChemGrid offers a free web-tool to generate box plot. With its BoxPlotR, you can easily generate custom box plot representations in different variants. To do that, you can paste your data or can upload your data file here. Once you input your data, it generates the box plots accordingly. You can access that under the Data visualization tab.
In the visualization, you can modify your data in case of any changes and apply additional plot options as well. You can set a minimum number of data points and add new data points, add sample means, set the box width and more. After adjusting the box plot as per your requirements, you can download it EPS, PDF or SVG file. It also gives you an option to download the box plot data as CSV file.
Try this box plot generator here.
Plot.ly
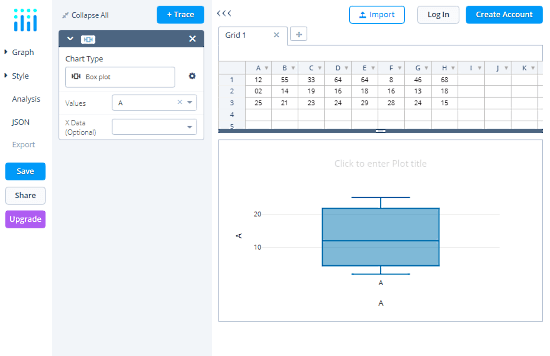
Give this box plot generator a try here.
Shodor.org
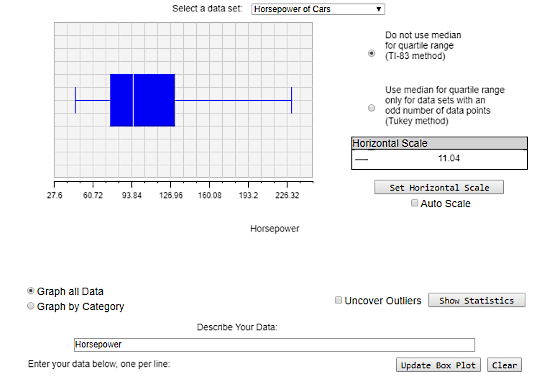
Shodor.org provides free online resources and tools for computational science. One of these tools is Box Plot Generator. When you enter your data into this tool, it instantly generates the box plot graph for that. It supports two box plot methods, Ti-83 method, and Tukey method. You can use any of these methods as per your convenience.
Apart from that, you can set the graph scale to auto like other box plot generator, or can define it manually. If you have multiple datasets, you can sort the graph by category to show all datasets together. And, you can name your graph and its axes and download it as PNG file from the right-click context menu.
You can try this box plot generator here.
iMathas.com
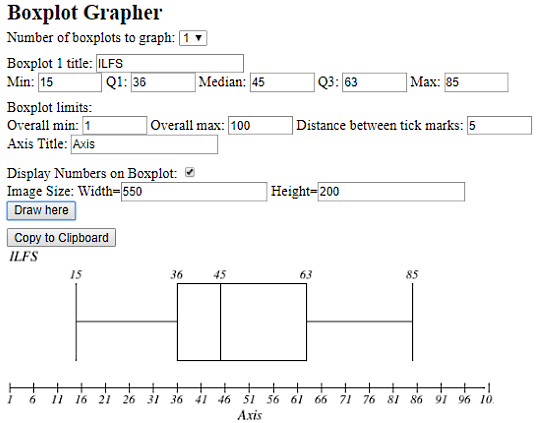
iMath offers a free online tool to generate the box plot representation. This simple tool takes your data and generates a box plot image which you can download or copy to clipboard. The whole point of this tool is to quickly generate box plot representation image of your data. To make the overall process simple, it asks for specific key values rather than the full dataset. Here, you can generate up to 3 box plot graphs within the same axis scale limits. It also lets you set the image size so there will be no need to edit or resize it later.
Try this box plot generator website here.
GeoGebra.org
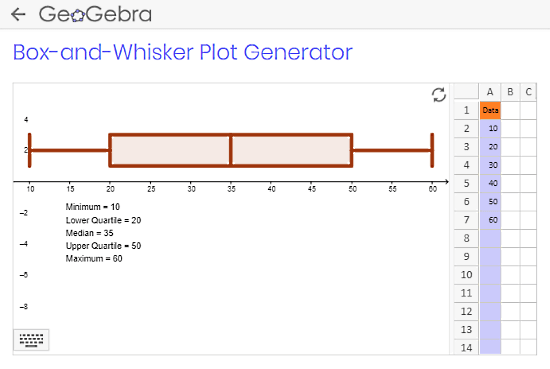
GeoGebra is a free website that offers online geometry tools and calculators along with a box plot generator. To generate box plot graph here, simply enter your data in the datasheet present at the left side. You can use the built-in keyboard to enter mathematical functions as well. After that, click the refresh button at the top left corner to generate box plot for your data. This will generate box plot for your data and list its key values as well.
Check out this box plot generator here.
Math.andYou.com
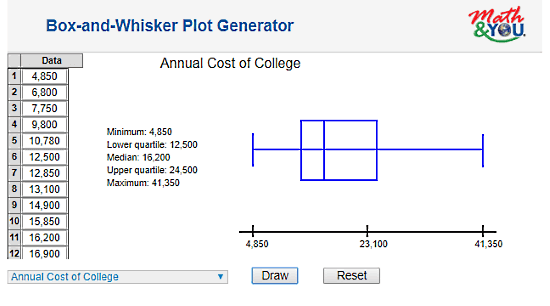
Math.andYou is another website that packs lots of math related content and tools. With its Box-and-Whisker Plot Generator tool, you can easily generate box plot. This tool is similar to GeoGebra in terms of functionality and use. You have a table on the right side to input the data. Then, by clicking the ‘Draw‘ button, you can generate its box plot representation. This tool also lists the key values and shows them alongside the box plot.
Try this box plot generator here.
Alcula.com
Give this box plot generator a try here.
MrNussbaum.com
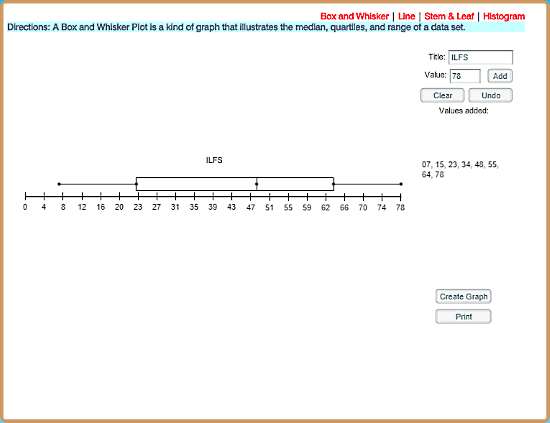
MrNussbaum is an educational website that uses various interactive ways to help kids and students learn new things. It has a simple box plot generator tool to make box plot graph from data. To generate the box plot here, first, add your data values to the tool. To do that, enter a value in the value box and click the ‘Add‘ button. Repeat the same to add the desired number of values. Once you entered all the values, click the ‘Create Graph‘ button. This will generate the box plot graph for your data. Here, you can save the graph by printing it to PDF.
You can try this box plot generator here.
EasyCalculation.com
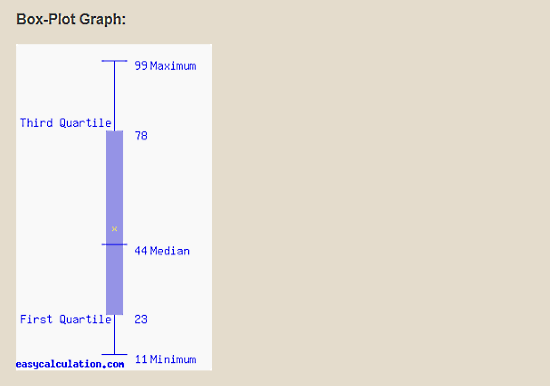
EasyCalculation has a simple box plot generator tool which you can use to create box plot graph easily. To do that, simply enter your data values in the input box separated by commas. Then, click the ‘Generate Boxplot‘ button to plot the graph. This will give you the box plot graph for your data. This tool mentioned all the key values on the graph rather than showing them separately.
Check out this box plot generator here.
Desmos.com
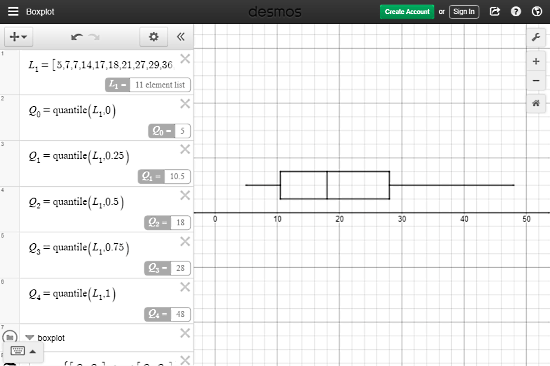
Desmos offers a set of online calculators for various mathematical calculations along with a box plot generator. It is more of a manual box plot maker. To generate the box plot, you have to enter your data in proper format/syntax. You have to enter your data string under L1 and define the values for each quarter. Along with that, you have to manually enter the box plot functions to draw it on the graph. This tool can be good for the math students and professionals, but for others, it’s a fairly complex box plot generator.
Try this box plot generator here.
Wrap Up
All these box plot generator websites are very efficient and simple to use. You can easily generate box plot graph using any of these. ChemGrid and Plot.ly sitting at the top offer additional features to import dataset and save the output. But, if you simply want to generate box plot quickly then iMath is a good option to go with.