Git Heat Map is a free and open-source tool that allows you to visualize a GitHub repository according to the diff activity. It allows you to visualize all the files of a Git repository by the change’s history. The files that are modified are shown with big size and files that have been modified the least are shown with small size. As the name suggest, this tool basically shows you the heat map of a Git repo so you can quickly analyze which files are being modified more.
This tool is completely free and open source. You can run it on tour PC, and it generates the heat map as SVG that you can later save on your PC if you want to. Additionally, it offers you some filters to change the view. If you only want to include some files based on different criteria then you can easily do that here.

Using Git Heat Map to Visualize the Git Repository:
Right now, the only way to use this tool is by self-hosting it. For that, you only need Python installed on your PC and Flask module too. If you have these requirements setup, then you can just get started.
Follow these steps to setup Git Heat Map.
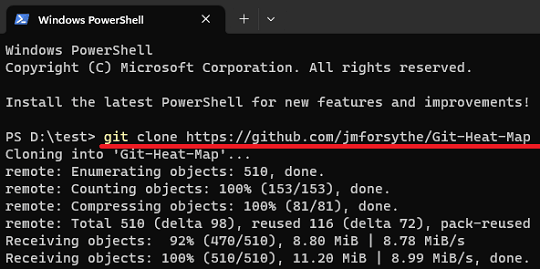
- Clone the GitHub repo of this tool:
git clone https://github.com/jmforsythe/Git-Heat-Map
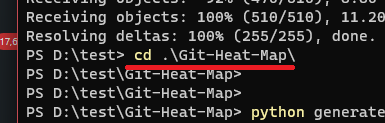
cdinto the cloned repository folder:cd Git-Heat-Map
- Run the
python generate_db.py {path_to_repo_dir}to generate the database to be displayed in the browser
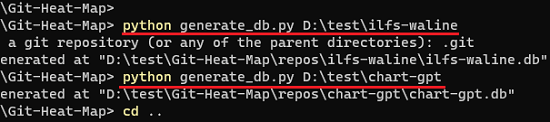
In the above command, you need to replace “{path_to_repo_dir}” with the path to a actual Git repository that you want this tool to visualize. It will analyze all the files and diff activity and then it will create a SQLITE database file in .db format.
Running this tool to see the visualized Git repo:
In the above section, you can generate the diff database for multiple repositories and then it will keep track of all of them. You can process unlimited Git repositories and then once you are done, it is time to run it.
Make sure that Flask is available, if not then you can run the following commands to install it.
pip install flask
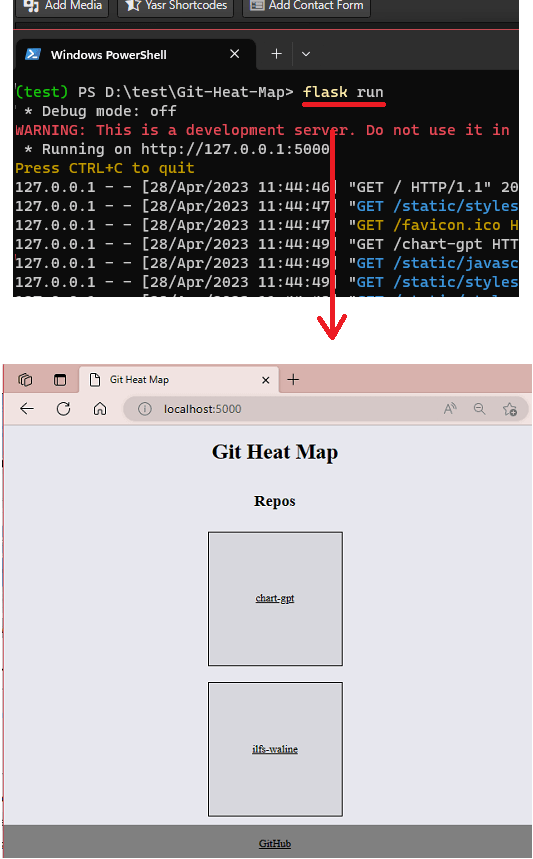
Now, you run the Flask server. Simply issue the following command and then in your browser, type http://localhost:5000. The main UI of the tool will show up now. Here it will show you names of all the repositories that you have processed via it.
flask run
Click on any repo name and then it will show you the Git heat map. You can now visualize all the files in the selected repository. The files that are changed more frequently will be displayed with larger pixel. You can see this in the screenshot below.
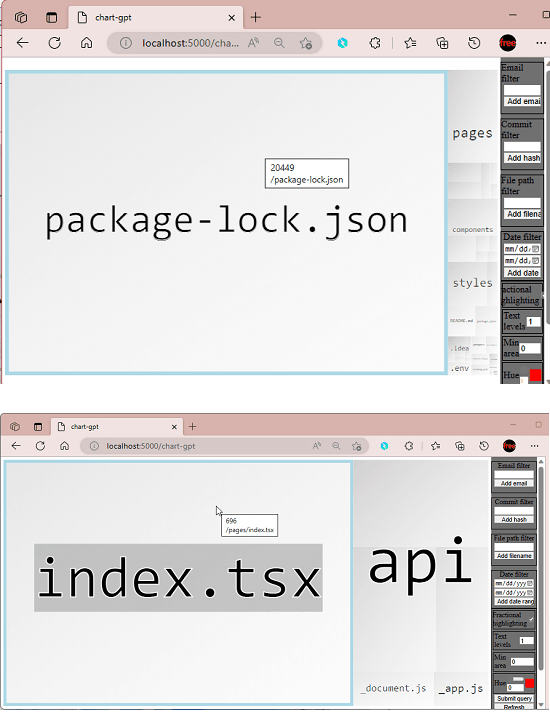
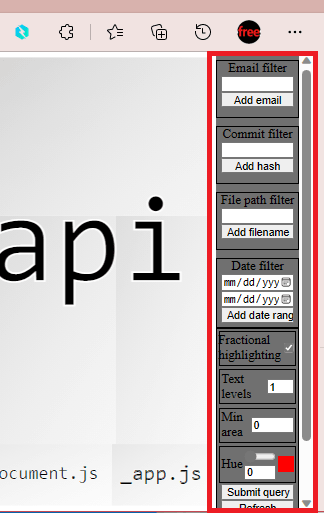
You can now keep browsing the different folders of the selected repository and then visualize the file. Or you can also go back to the homepage and start with a different repo. In the sidebar, you will see some filters that you apply to see exactly what you want. You can opt to filter files by path, date, and email.
In this way, you can now use this Git Heat Map tool to visualize any Git repo in a few seconds. All you have to do is just issue a few commands and then process any git repo with it. You can always run it locally or you can host it on a server so that you can come back to it and start using it right away.
Closing thoughts:
If you are looking for a free tool to see the Git history visualized on a webpage, then this tool I have mentioned here will be helpful. You just give it a git repo and based on the diff activity; it will highlight the files for you. I also liked the fact that it allows you to filter the files based on different criteria. So, give this a try and let me know what you think.