Statpedia is a free website to quickly create chart from data. The website first lets you create data of your choice (data related to finance, population, smartphone sales, or anything) and then you can turn that data into chart easily. You can generate the pie chart, histogram, bar, heat map, or other types of chart.
You can also download your chart as PDF, PNG, SVG, and JPG image. Apart from that, it also lets you publish and embed chart, but you need to create a free account to use these two features.
There are hundreds of charts (or Stats) also available on this website, which are published by other users. You can search for any type of chart using the keywords and then download the chart for later use.
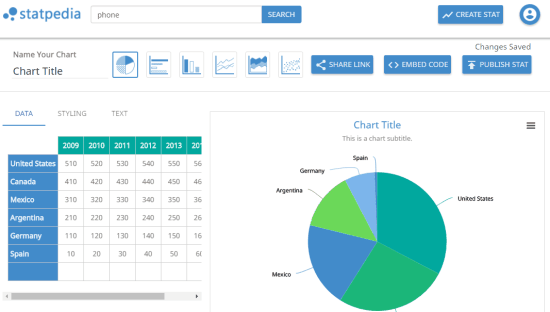
In the screenshot above, you can see a chart generated by me from some data and other charts available on its interface.
Note: A small watermark is added on the bottom right side of the downloaded images. However, I believe the website is really good for personal use or when you need to share the chart with your team.
Also, check these similar websites: TinyChart and Datawrapper.
How To Turn Data Into Chart Using This Free Website:
Open the homepage of this website and you will see a sample data which you can edit to generate a sample bar chart. You can also search for other charts posted by users by using the search box.
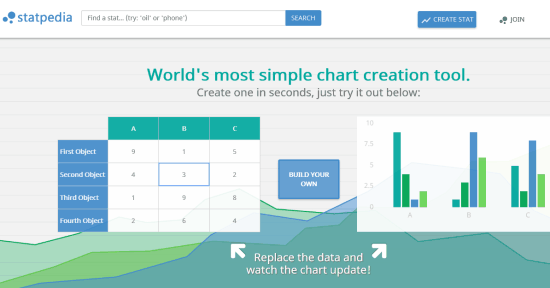
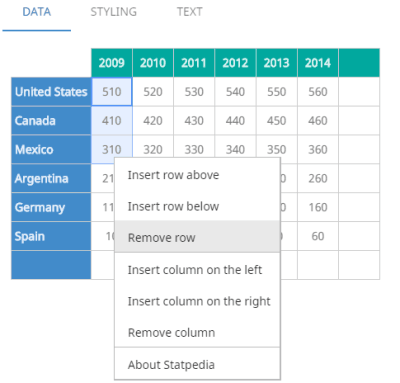
To create your own chart, you can use the available button. After that, a sample sheet will be in front of you with some random data. You can edit all that data. Just double-click on any cell and you can edit the data. To add more rows and columns, you can take the help of right-click context menu options.
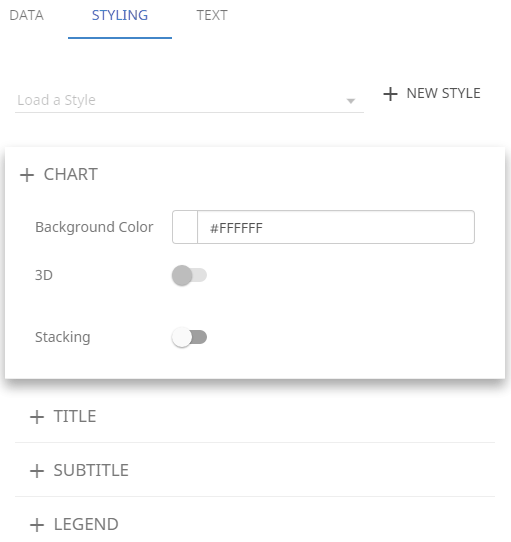
You can also set the styling for output chart. For example, you can set the background color of chart, set the font size for title, font color, and do many other things.
When your data is prepared, it’s time to select the output chart. Click on any of the available charts and it will visible on the right side. So, you can easily see the original data and output chart generated from that data. You can edit data and see changes quickly in the output chart.
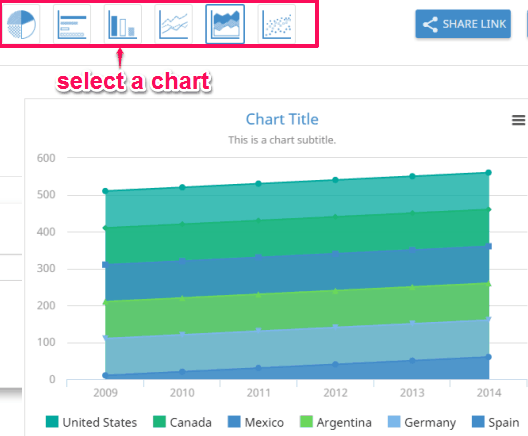
When the output is good enough, you can share it with others, grab the embedding code, and publish the chart. To download your chart, you can click on hamburger icon (three horizontal bars).
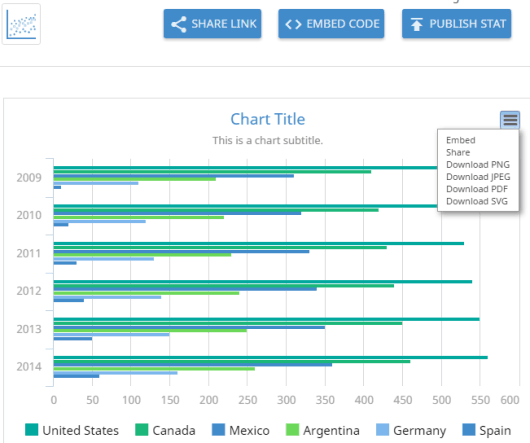
The chart can be downloaded as PNG, SVG, PDF, or JPEG image.
The Verdict:
Creating the visual chart(s) from data is good as you can have a better look on your data and can also understand it easily. Also, you can share the chart with others and grab a copy of your chart, which make this website more useful.