WordMat is a free add-in for MS Word to solve equation, plot graph, and more. It adds a new new tab to MS Word, which basically adds math functionality to MS Word. This allows MS Word to directly solve mathematical equations and plot graphs. It lists all the most used mathematical formulas of Maths, Physics, and Chemistry. You can either directly insert formulas from here or you can use one of these to create your own formula.
WordMat was basically made to cover the syllabus of high school equivalent in Denmark, where computer math tool is allowed to be used extensively, even during exams. However, now it is being used in many different educational institutions. It is available in only Danish and English (some parts are yet to be translated in English).
Despite being developed for only Danish high school students, it can be easily used by anyone to solve mathematical equations and plot graphs in MS Word.

You can also take a look at this software to write math equations, which lets you paste equation directly in MS Word.
How To Solve Equations And Plot Graphs In MS Word:
WordMat is a very useful add-in for Microsoft Word to solve equations and plot graphs. All you have to do is, download and install WordMat from the link at the end of this review, and WordMat tab will automatically appear in MS Word. This tab contains all the options for solving equations, plotting graphs and more.
WordMat tab has the following 6 categories: Formulae, Settings, CAS (Computer Algebra System), Plottings, Statistics/Probs, and Diverse. These categories contain all the sub-options of WordMat.
- Formulae: This sub section lists formulas of Percentage, Functions, Geometry, Inf, Prob., and Vector. It also has separate lists of formulas for Maths, Physics, and Chemistry. You can easily insert these formulas by selecting them. You can also use these formulas to create your own equations.

- Settings: It contains all the settings related to CAS, Notations, Graphs, Units, Numbered Equations, Backup, and Advanced.
- CAS Settings: Under this menu, you get to choose the size of Significant figures. Here you can choose whether you want to show Scientific notation, Units, Complex Numbers, Polar Notation Output, Degrees or Radians as angle unit, etc. You also get to choose the Logarithm output among, Auto, Ln, or log. You also get to choose Very High Precision(beta) for solutions, Show solution Conditions (beta), Insert Explanations, and Insert Maxima Command.

- Notation: It has the settings to decide Separators, Solution Type, Subscript, Multiplication Sign, and use of regular d as differential d.

- Graph: Here you get to choose the standard graph program for plotting graph. You can choose from Gnuplot, Graph, GeoGebra, or Excel.

- Units: If you want to add any non SI Unit as output unit, then here you can add them. You just need to separate different units with a comma.
- Numbered Equation: It lets you adjust the Placement (left or right) and Numbering [(1) or (1,1)] of the equations.

- Backup: It has all the settings related to backup like, Automatic backup, Number of files to store as backup, and the time between each backup.

- Advanced: Here you can find settings like Start Automatically with Word, Automatically Check for Updates, Choose language, etc.
- CAS Settings: Under this menu, you get to choose the size of Significant figures. Here you can choose whether you want to show Scientific notation, Units, Complex Numbers, Polar Notation Output, Degrees or Radians as angle unit, etc. You also get to choose the Logarithm output among, Auto, Ln, or log. You also get to choose Very High Precision(beta) for solutions, Show solution Conditions (beta), Insert Explanations, and Insert Maxima Command.
- CAS: It basically means Computer Algebra System. Here, you can use the Calculate option to directly calculate or solve any equation.
- Calculate: It is used to directly solve any equation for its maximum value.
- los Ligning(er): Differential equations can be easily solved using this option.
- Definitions: Here you get to delete definitions, define variable, define function, define equation, define physical constants.
- Reduce: It helps to Simplify, Factor, and expand equations.
- Infinites: Here you can choose whether you want to differentiate or integrate an equation.
- WolframA: This is for Wolfram Alpha to solve equations.

- Plotting: It basically has the following graph related options;
- Show Graph: Here you can choose any one of these graph plotting programs, GNU Plot, Graph, GeoGebra, and Excel.
- 3D Plot: It helps in plotting 3D Rotate Graph about x axis.
- Statistics: It is used to draw Stick Chart, Histogram, Step Chart, and Cumulative Chart.
- Statistics/Probs: It is used to insert different types of tables and Binomial, Normal, or x2 distribution. You can also carry out Binomial Test and x2 test. However I wasn’t able to test it, as it was fully in Danish language.
- Diverse: It basically contains different types of mathematical Symbols and Figures to insert in any equation. You can also insert Excel Table and Triangle. It also has the option to draw any thing on the equation or graph. The most Important option under Diverse is New Equation, which allows you to create new equation using different mathematical signs including Integral, radical, Script, Fraction, Large Operator, brackets, Functions, etc.
These categories are in English, however, the texts that appear on hovering mouse over these options are in Danish, even the popups are in Danish language. So, for now its of limited use to English speaking people. Even its user manual kept on crashing and was of no help.
However it helps a lot to solve equations and plot graphs in MS Word. Let see how it can be used to plot graphs and solve equations.
How to Solve Equation And Plot Graph in MS Word With WordMat:
For solving equation in MS Word using WordMat, you need to first enter the equation in MS Word. You can either insert equation from Formulae section or you can create a new one by using different mathematical symbols and figures from New Equation option in Diverse section. Or you can simply copy and paste the equation from anywhere.
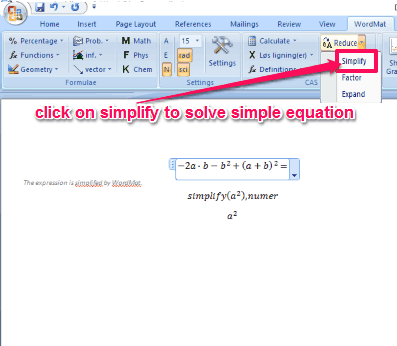
I am taking a simple example to show how its done. I will try to solve the following equation;
{-2a*b-b2+(a+b)2}=?
In order to solve this equation, first you need to insert this equation in MS Word and then you need to click on Simplify under Reduce option in CAS Section. And the solution a2 appears as soon as you click on Simplify.
Now lets see how to plot graph here.
Plotting graph is quite easy with WordMat; you just need to click on Show Graph. It will open a new 2D plotting window, where you need to enter all the required values and click on Update option. And, you will be able to see preview of the plotted graph on 2D plotting interface.
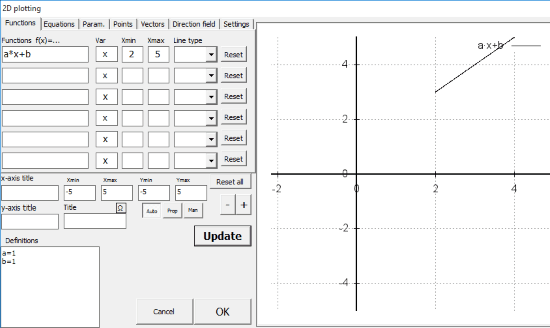
Then you need to click on OK to get the graph plotted on MS Word.
Here, I Have tried to plot the graph of “a*x+b”. Where minimum value of “x” is chosen 2 and maximum value of “x” is 5 with definition of “a” and “b” is taken 1.
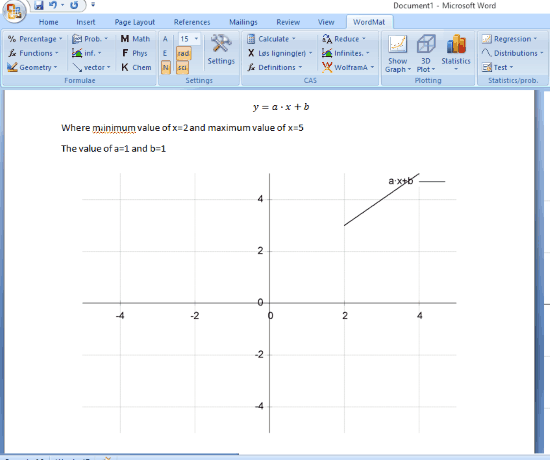
This way you can easily use WordMat to Solve equations and plot graphs on MS Word.
Verdict:
WordMat is a free add-in to solve mathematical equations and plot graphs in MS Word. It has many other useful features as well but since they are mostly described in Danish language so its tough to know what to do with them.
If you are only looking for an add-in to solve equations and plot graphs in MS Word, then you should give it a try.