Opsview Core is a free server, network and system monitoring software. It’s aimed at large organizations with complex IT systems, where a lot of computers, not just servers, have to be managed and monitored. This is actually a server application itself, which you install on computer and then access it via web browser. All the devices that you need to monitor have to be configured inside Opsview Core and from there on you can keep track of them.
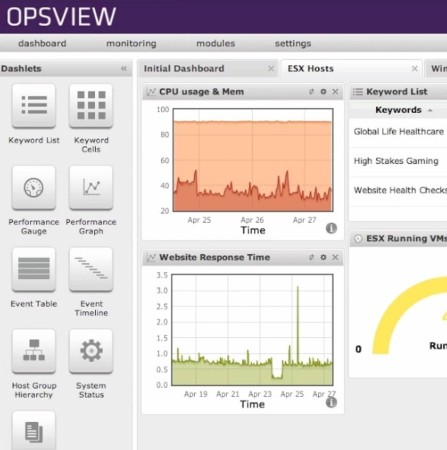
Default dashboard of this free system monitoring software can be seen on the image below.
Similar software: Windows Health Monitor, ManageEngine SQL Health Monitor.
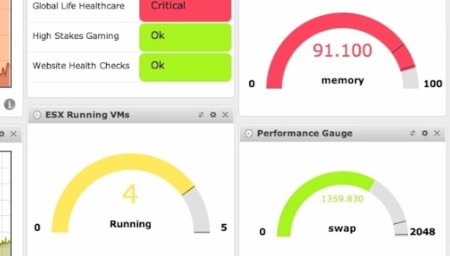
It can be arranged in any way you want using Dashlets, they can be added from the left sidebar and some of them can be seen in action on the right. Main menu at the top can be used to switch between dashboard, detailed monitoring, settings and various other available modules. Layout of the dashboard can be changed, there’s 6 different layouts to choose from, and new ones can be added as tabs. Key features of Opsview Core – free system administration software are:
- Simple and easy to use interface with modern design and appeal
- Network monitoring – keep track of all the computer on your network
- System status checker – memory usage, CPU stats, response times, etc.
- Software monitoring – monitor running applications and services
- Cross platform – can be used on both Linux and Solaris OS
- Add unlimited number of computers and servers to the list
Opsview Core is built on top of Nagios, which is also a system management platform. All the same plugins that are available in it’s predecessor are also available and can be used in Opsview Core. Core is the free version of Opsview. Next to it, there’s also a paid one which offers more features, more dashlets, more information about the monitored servers and networks and so on. Here’s a few pointers to help you get started.
How to monitor servers, networks and systems with OpsView Core
Computers that you’re interested in monitoring first have to be added to the Opsview. This can be done automatically using the client discovery feature.
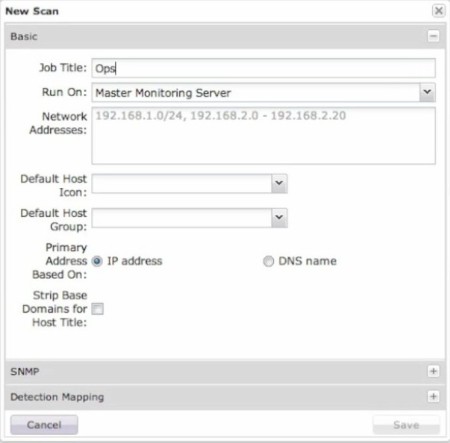
Open up the Monitoring tab, find Autodiscovery from the menus and once you’re there click on the New Scan button. Window which can be seen above will pop-up. Fill everything that’s asked and click Save. Run the scan and connected servers, users, computers should be detected.
This is just the beginning of the setup. From this point on, you can organize the dashboard, configure which information about network, server and system status is gonna be shown and so on. A lot more tweaking needs to be done.
Conclusion
Opsview Core gives you a lot of control over your infrastructure, it’s very easy on the eyes, which you can see from the screenshots above. Note that we reviewed already installed Opsview. Installation is a bit more tricky, virtual appliances are available for download though. Read more about how to setup on the website, links available down below. Free download.