Here are 5 free ping graph software to show ping response time graph. These software can ping an IP address and then record the corresponding response time by plotting it. You will see a ping graph on the interface of these software and in some of them you can also export graph to an image. Most of these software can ping multiple IP addresses and plot the corresponding response time graph accordingly. You can analyze the graph and switch to another type if you want. The response time graph uses mili second (MS) as a unit to measure the time.
Having ping graph for a particular host can be helpful to analyze the connectivity between machines. And that is what these software can do easily. You just have to specify the IP address or host name of the target PC or device and these software will do the rest. This will keep pinging the target until you close them. In the mean time, they will keep logging the ping operations including plotting response time graph.

5 Free Ping Graph Software to Show Ping Response Time Graph:
PowerPing
PowerPing is one of the best free ping graph software to show ping response time graph. This is actually a command line tool for pinging target computers and network devices. It comes with some really useful tools along with it and one of those tools is plotting response time graph. You can use this software to ping an IP address and it will record the corresponding response time graph for you. It creates a histogram to show response vs ping interval graph and keeps doing that until you stop it.
There is a simple command to plot ping response time graph. So, first open a command or PowerShell window (in cmd mode) in the folder where you have downloaded the EXE of PowerPing. After that, run this command in the following format.
powerping -g "IP address or hostname"
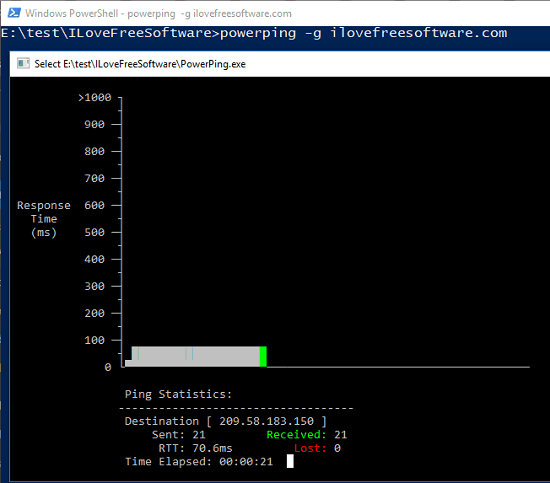
In the above screenshot, you can see how PowerPing plots the response time graph. However, it can only plot one response time graph at a time.
PingLogger
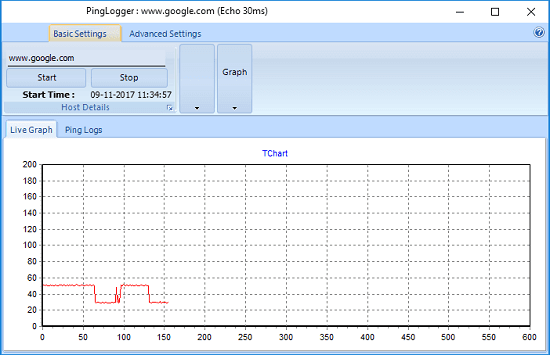
PingLogger is a GUI based ping graph software to show ping response time graph. It continuously keeps pinging a specified target computer or device and plots the corresponding response time graph. It comes with a responsive interface and adjusts the size and metrics of the graph according to the size of the whole window. You can use an IP address or a domain name to ping it continuously. There are some parameters that you can customize in this software. You can specify a desired packet size to ping target, specify intervals, specify timeout time, and export ping logs to a CSV file.
The PingLogger software comes as a portable software and you can use it without prior installation. Just run the software, specify the IP address or domain name to ping and start the ping operation. It will keep pinging the target and you will see the graph will update automatically according to the response of the ping. When you have enough data to analyze the ping operation, then you can stop pinging and export the ping logs as a CSV file. Use the advanced tab of the software to do that.
Ping Graph
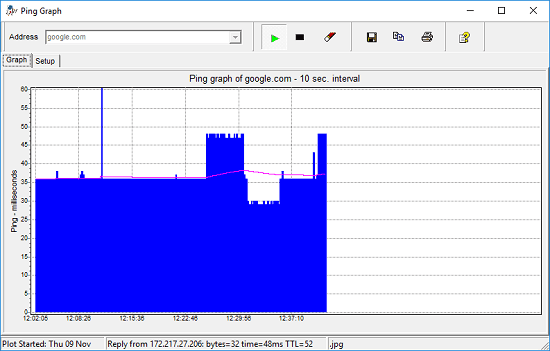
Ping Graph is another free ping graph software to show ping response time graph. The software comes with a simple interface and you can easily trace stats of a ping operation. You can use this software to continuously ping a target machine and it will record the stats as a graph. And it allows you to export the graph as a JPG image to any folder you like. In addition to that, you can also switch the graph to another type as well. It supports linear, filled, steps and ramped graph to show ping response times and you can also change the graph colors.
Using Ping Graph software to show ping response time is very simple. As soon you open the software, its interface will open up and in the Address field, you can specify the name of the host or its IP address you want to ping. After that, click the play button and it will start pinging to that target. The corresponding response time will keep recording and once you are done, you can either stop the ping operation or keep it running. This software allows you to export the graph as an image. Or, you can also opt to copy the graph image to clipboard. Use the respective buttons from the toolbar of the software to do that.
WinPing
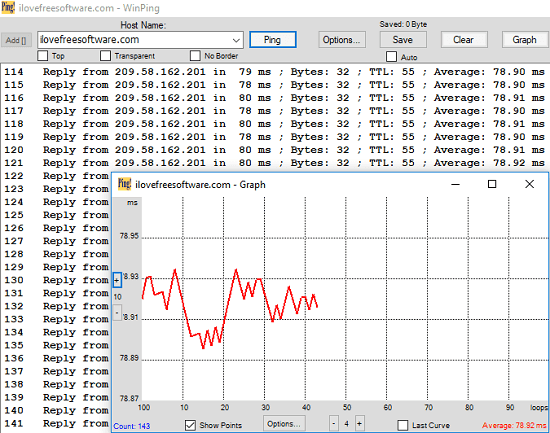
WinPing is a freeware ping software that can ping multiple hosts at once and can show you response time graph along with it. The graph that it generates can be switched to various resolutions to get clear ping analytics. You can use this software to analyze the ping stats and do whatever you want. However, there is no option in it to export the graph. But it does come with some other set of features. It comes with a traffic monitor to see upload and download speed and it can auto-resolve names of domain with the help of IP address you use in it.
WinPing is a portable tool so open it right after you have downloaded it. Specify the IP address or domain name and hit start ping button to start pinging it. But do note that, by default, it will only ping once and then it will stop. To make it keep pinging the target, you will have to check “Infinite Ping” in the options window. After that, you will be able to record response time graph in the software. While the software is pinging the target machine, you can open the graph window and see the graph. The graph supports zoom feature. You can use the “+” and “-” buttons to zoom in and out on the graph.
GPing
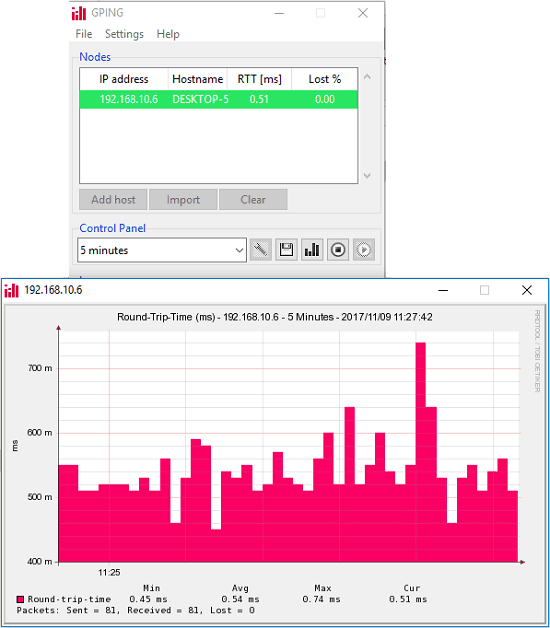
GPing is an acronym for Graphical Ping and it is yet another free software to show ping response time graph. It plots a histogram to indicate the ping response and lets you export the graph as a PNG image. Not only that, when you export graph it also saves a CSV file which has log of all the ping requests it has generated. It comes with a simple interface and can ping multiple IP addresses as well. In addition to that, you can opt for some other features as well. It allows you to change the color, height, width of the graph right from its control panel. However, to make it work, you will have to run it with administrator rights.
GPing doesn’t require a prior installation and can work right after you download it. Add the names of hosts or their IP addresses in it and start the ping operation. If the host exists, then it will highlight its name with green color and will start plotting the graph. The graph is in real-time and it will keep recording it unless you stop it. Once you have stopped the ping, the graph will also stop and you can export it. To save the graph, hit the save button from the interface of the software. It will ask you to specify the directory where it will save the graph image along with the CSV file.
Final Words:
These are some of the best free ping graph software to show ping response time graph. All of these software in the above list are capable enough to do that. Personally, I like PowerPing and Ping Graph. So, if you are looking for some handy ping graph software to generate response timer graph, then this list might come in handy.