Chartico is a free online tool to create stunning bar charts in no time. It lets you easily design a quick visual of your data in the form of a bar chart. You can adjust layouts and pick different colors for each bar to make the chart more beautiful. Initially, you will be able to see three bars with different sizes. You can duplicate them by clicking the bar and selecting the “+” icon and also remove a bar by selecting the “-” icon.
The best part of this tool is that you can add title, sub-title, and values which get auto-adjusted. That means, when you type a value for a particular bar, the bar gets auto-placed as per the value entered. After you’re done with playing around and creating a bar chart, simply share it or save it as an image file. It offers more than 10+ color for bars and various ratios such as 16:9, 4:3, and 1:1.
How to Create Stunning Bar Charts with Custom Designs:
Step 1: Simply go to the website and start creating beautiful bar charts for your data. You don’t have to sign up or register to use the service.
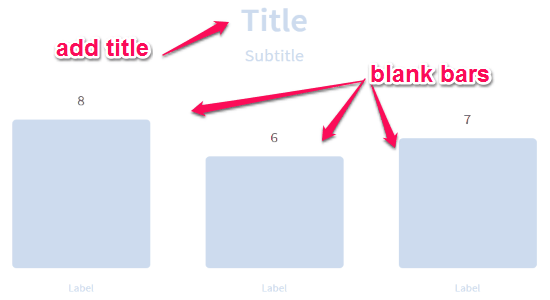
Step 2: As soon as you open the tool, you will see three colorless bars of different size. You can type the title and sub-title for your bar chart in the respective boxes.
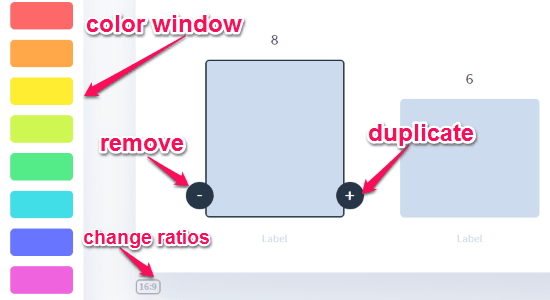
Step 3: Below the bars, there will be an option to change ratios to either 16:9, 4:3, or 1:1. When you click a bar, the color window will pop up on the left. You can pick any color for that particular bar. The “+” and “-” icons can be used to duplicate and remove a bar respectively.
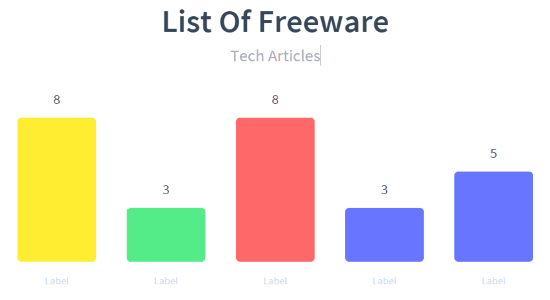
Step 4: When you type a value for a bar, it will automatically adjust to that particular value. This feature is very useful as you don’t have to adjust the values manually.
Step 5: After you’re done with creating the bar chart, you can either share it via Facebook and Twitter or save it as a JPG file.
My Final Verdict:
Chartico is a very useful online tool to create a visually appealing bar chart for your data. You can adjust the bar layout by simply typing the value at the top of the bar. Add as many bars as you want using the “+” icon. Choose among 10+ different colors to make the bar chart stunning.
Try “Chartico” from the link here.